FIGURE 4-2
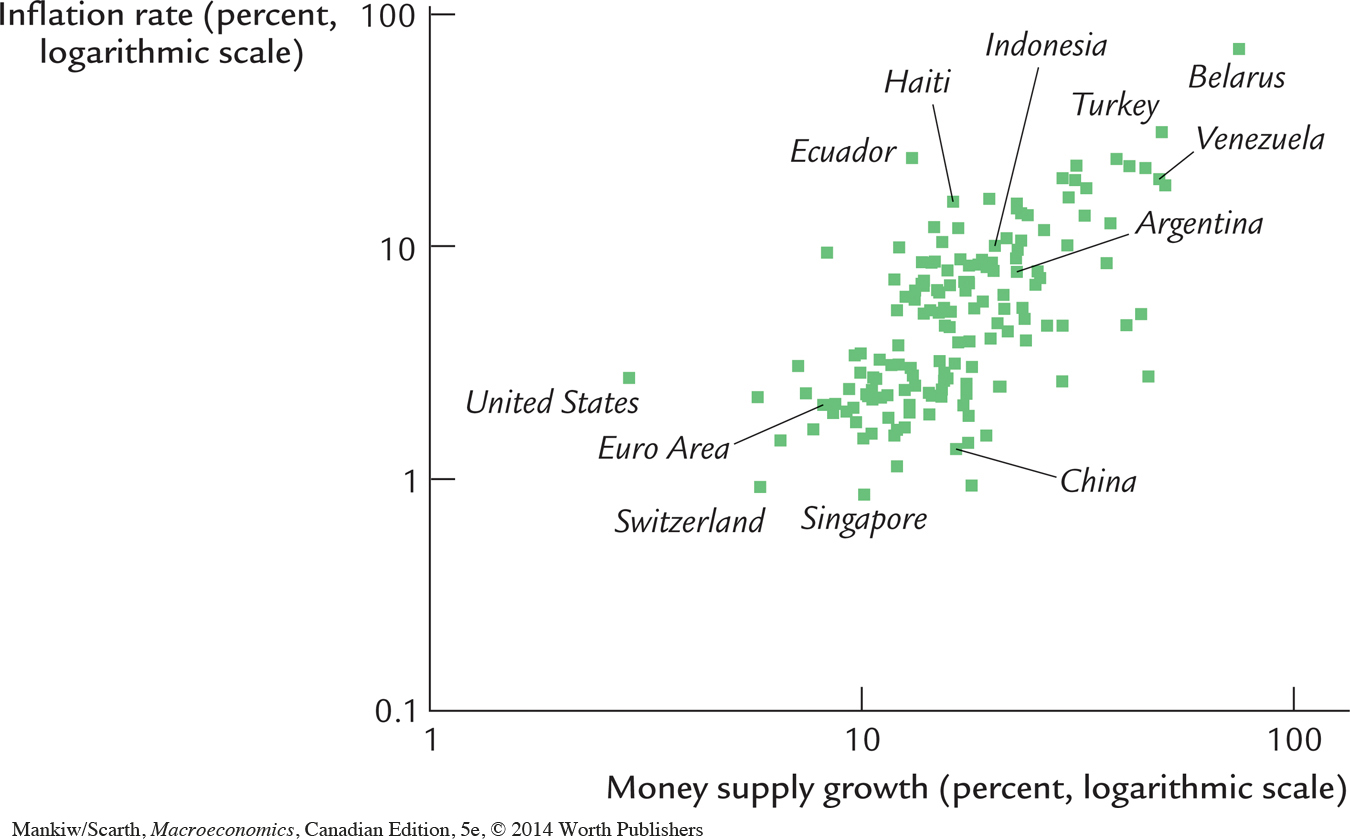 International Data on Inflation and Money Growth In this scatterplot, each point represents a country. The horizontal axis shows the average growth in the money supply (as measured by currency plus demand deposits) during the period 1999 to 2007, and the vertical axis shows the average rate of inflation (as measured by the CPI). Once again, the positive correlation is evidence for the quantity theory’s prediction that high money growth leads to high inflation.
Source: International Financial Statistics.