FIGURE 4-3
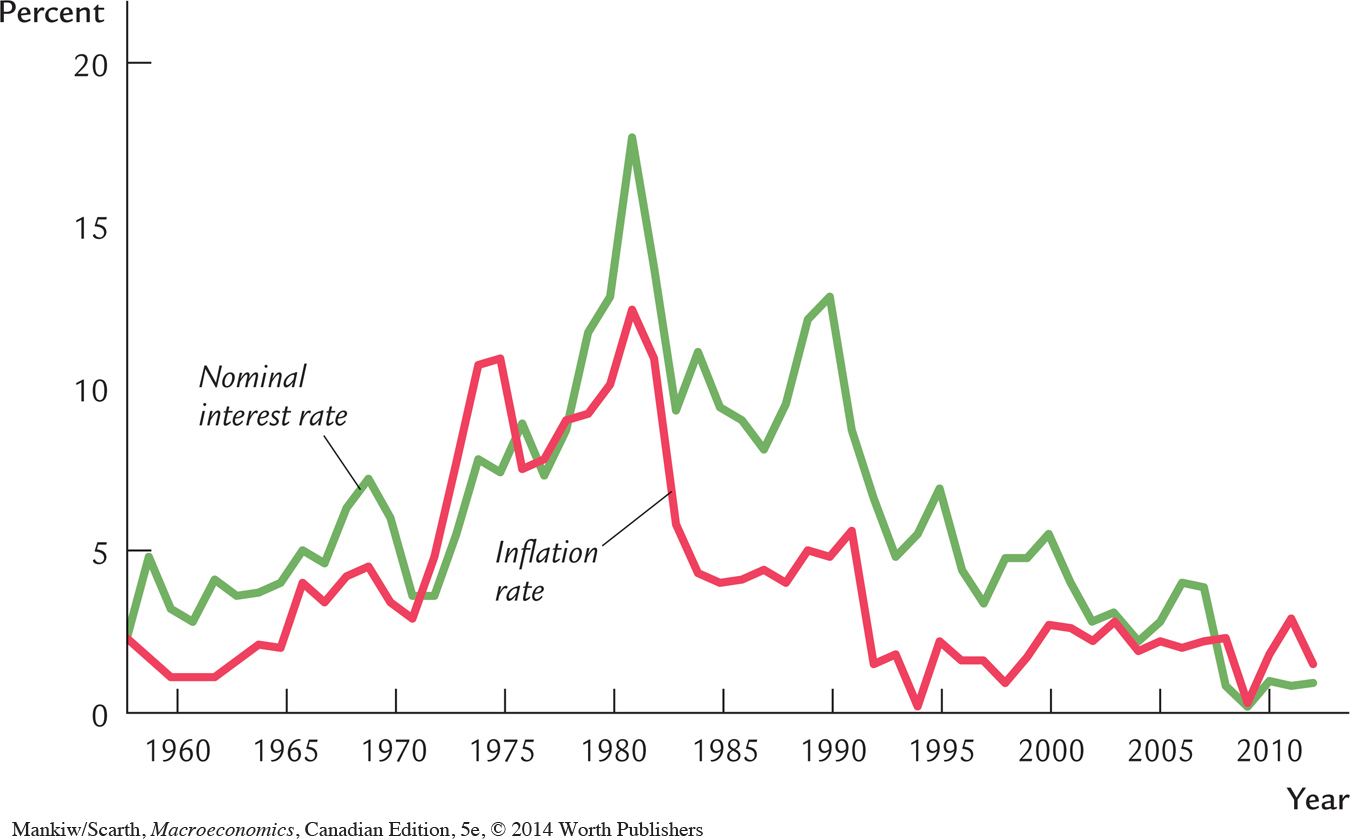 Inflation and Nominal Interest Rates Over Time This figure plots the nominal interest rate (on three-month Treasury bills) and the inflation rate (as measured by the CPI) in Canada since 1956. It shows the Fisher effect: higher inflation leads to a higher nominal interest rate.Source: Statistics Canada CANSIM Series 122484 and 737344