FIGURE 7-6
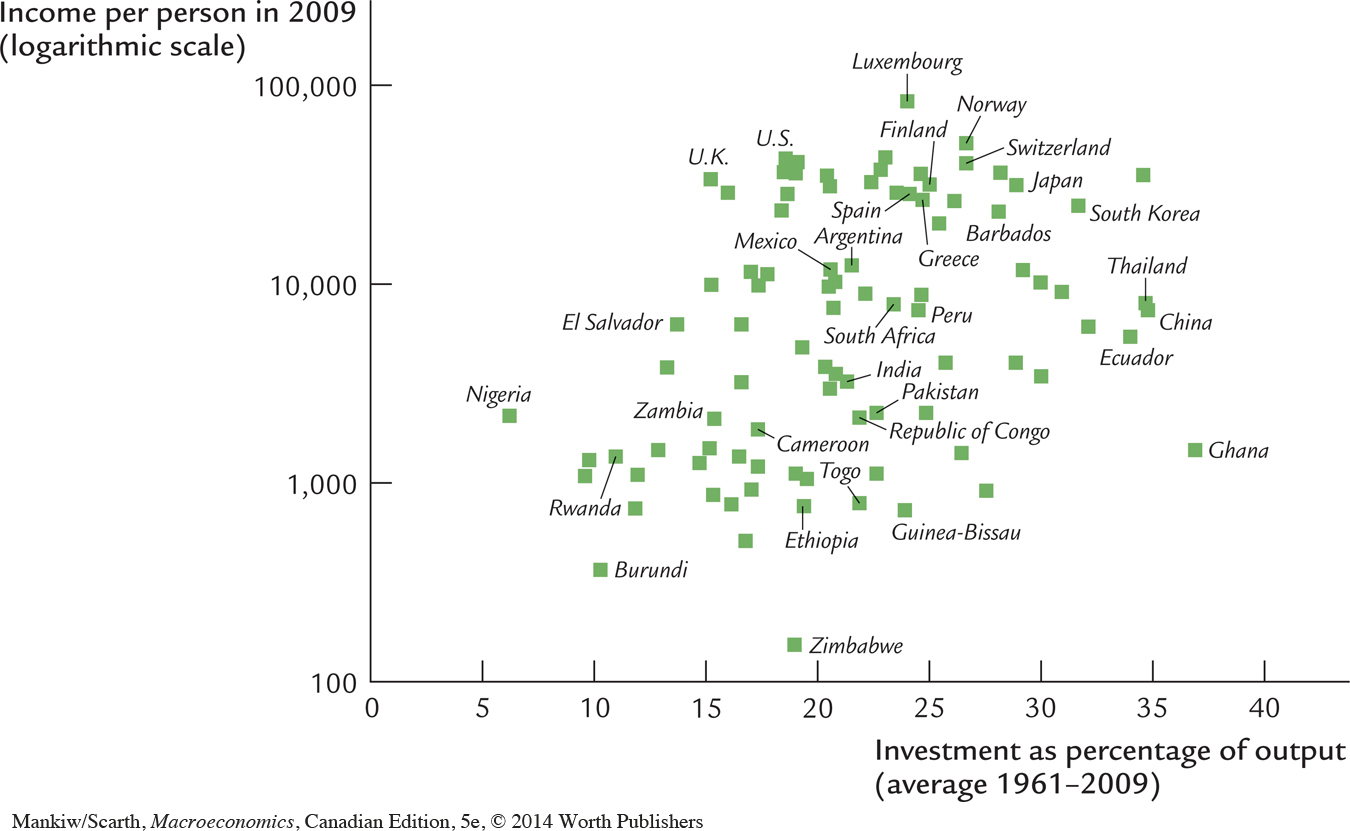 International Evidence on Investment Rates and Income per Person This scatterplot shows the experience of about 100 countries, each represented by a single point. The horizontal axis shows the country’s rate of investment, and the vertical axis shows the country’s income per person. High investment is associated with high income per person, as the Solow model predicts. The correlation between these two variables is 0.25. Source: Alan Heston, Robert Summers, and Bettina Aten, Penn World Table Version 7.0, Center for International Comparisons of Production, Income, and Prices at the University of Pennsylvania, May 2011.