FIGURE 9-2
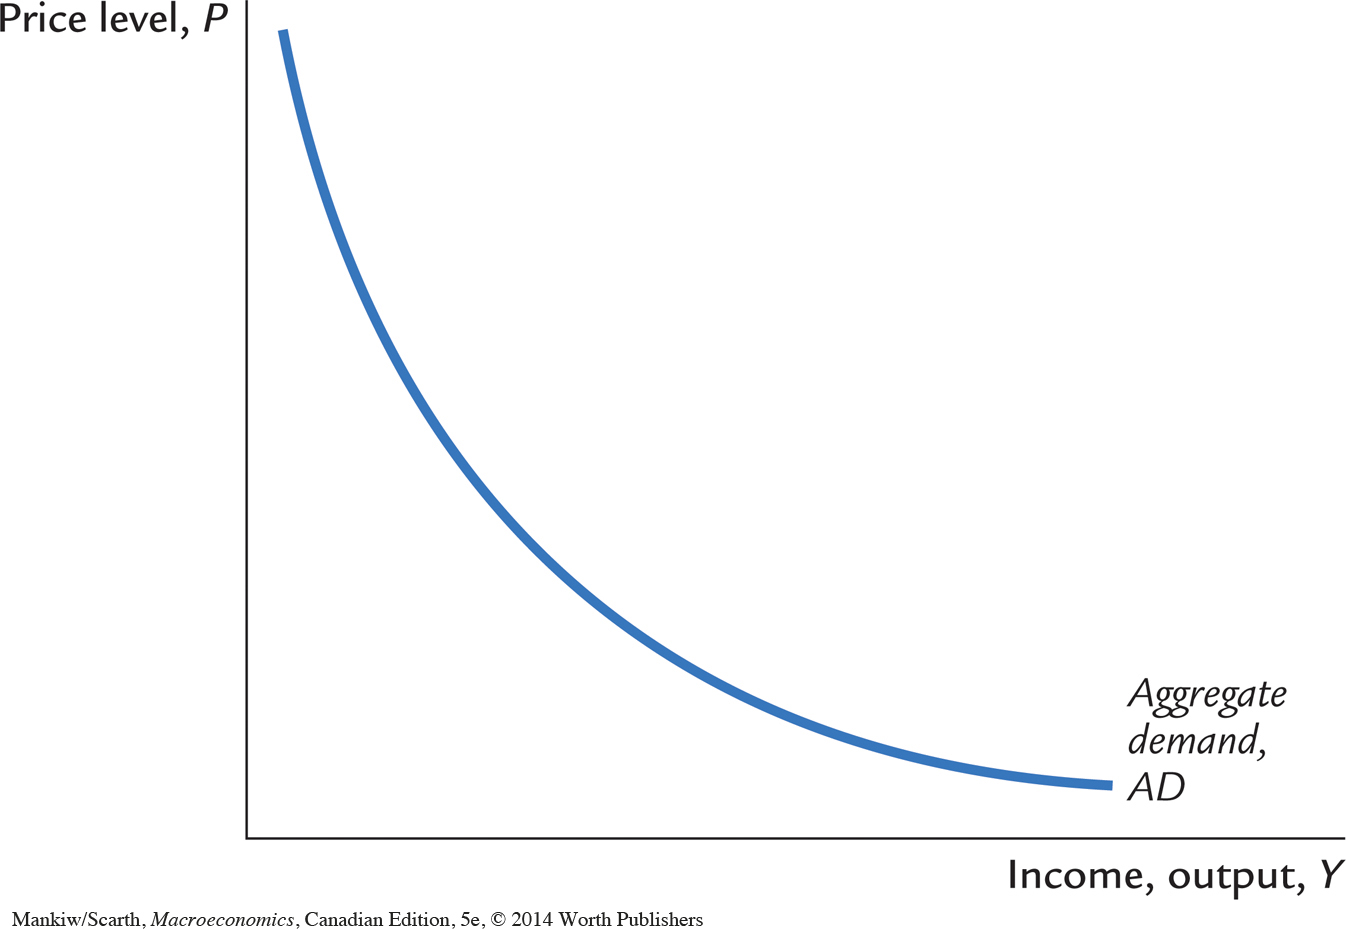 The Aggregate Demand Curve The aggregate demand curve AD shows the relationship between the price level P and the quantity of goods and services demanded Y. It is drawn for a given value of the money supply M. The aggregate demand curve slopes downward: the higher the price level P, the lower the level of real balances M/P, and therefore the lower the quantity of goods and services demanded Y.