FIGURE 10-12
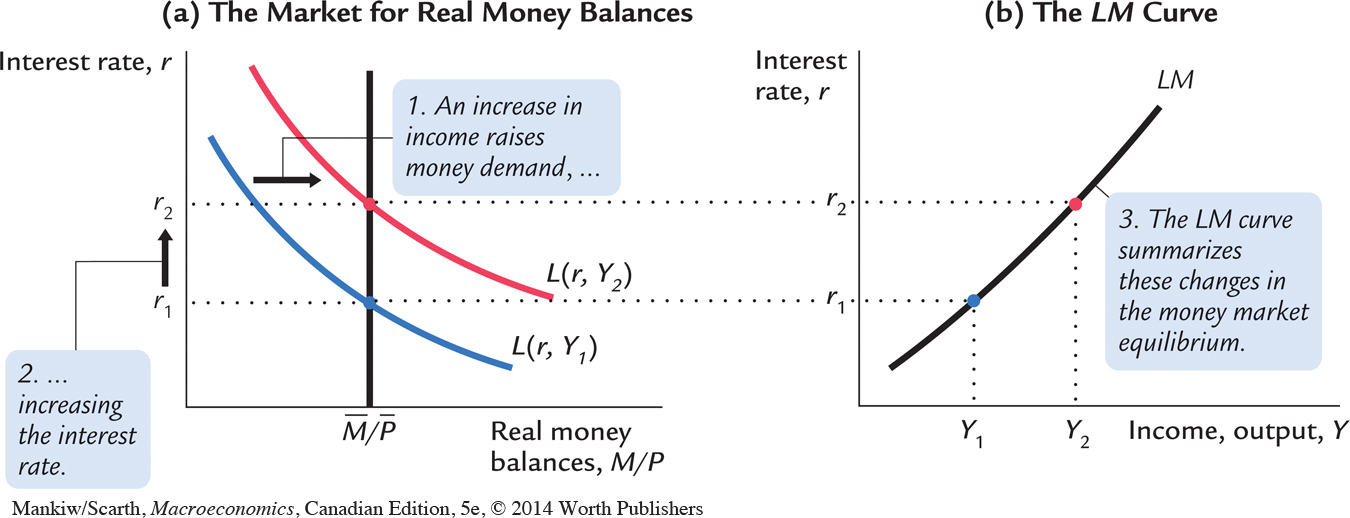 Deriving the LM Curve Panel (a) shows the market for real balances: an increase in income from Y1 to Y2 raises the demand for money and thus raises the interest rate from r1 to r2. Panel (b) shows the LM curve summarizing this relationship between the interest rate and income: the higher the level of income, the higher the interest rate.