FIGURE 10-15
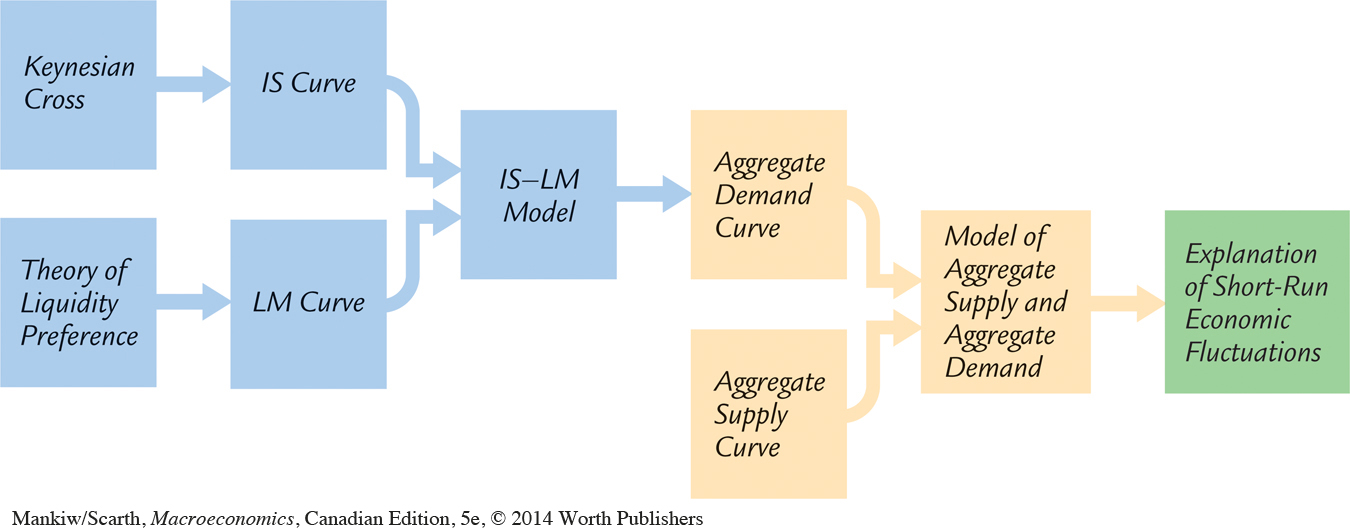 The Theory of Short-Run Fluctuations This schematic diagram shows how the different pieces of the theory of short-run fluctuations fit together. The Keynesian cross explains the IS curve, and the theory of liquidity preference explains the LM curve. The IS and LM curves together yield the IS–LM model, which explains the aggregate demand curve. The aggregate demand curve is part of the model of aggregate supply and aggregate demand, which economists use to explain short-run fluctuations in economic activity.