FIGURE 11-5
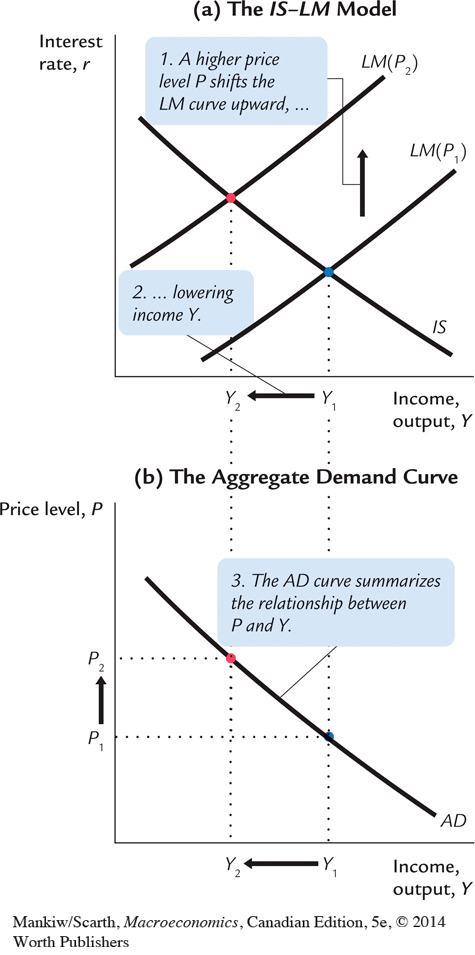 Deriving the Aggregate Demand Curve With the IS–LM Model Panel (a) shows the IS–LM model: an increase in the price level from P1 to P2 lowers real money balances and thus shifts the LM curve upward. The shift in the LM curve lowers income from Y1 to Y2. Panel (b) shows the aggregate demand curve summarizing this relationship between the price level and income: the higher the price level, the lower the level of income.