FIGURE 11-7
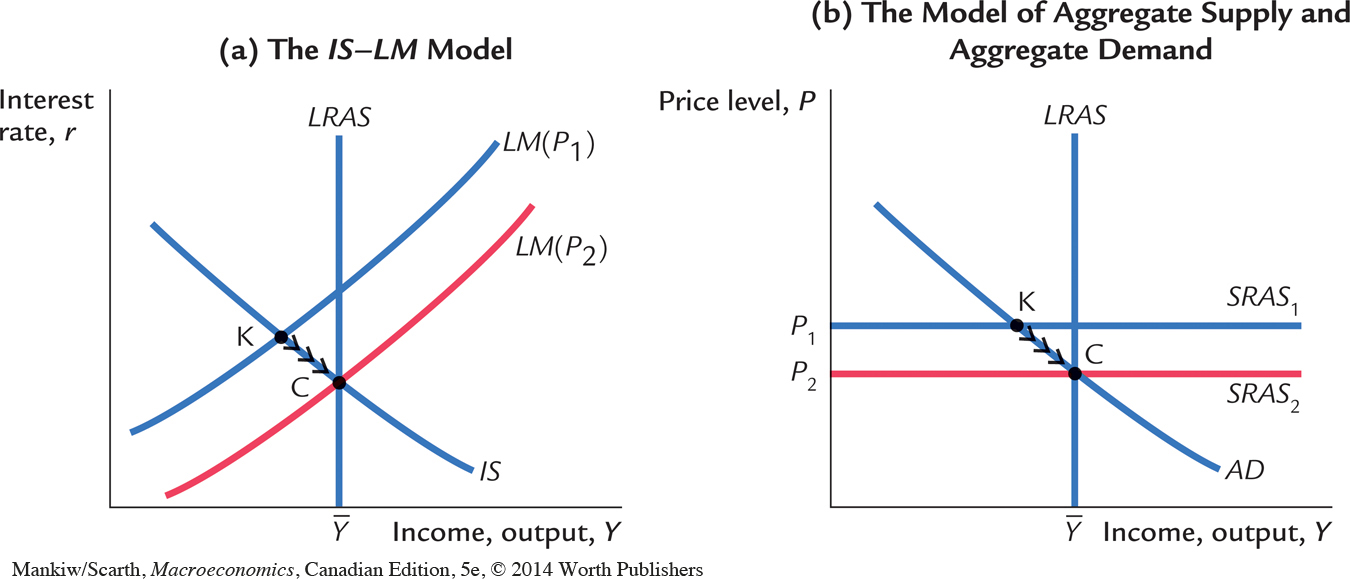 The Short-Run and Long-Run Equilibria We can compare the short-run and long-run equilibria using either the IS–LM diagram in panel (a) or the aggregate supply–aggregate demand diagram in panel (b). In the short run, the price level is stuck at P1. The short-run equilibrium of the economy is therefore point K. In the long run, the price level adjusts so that the economy is at the natural level of output. The long-run equilibrium is therefore point C.