FIGURE 14-2
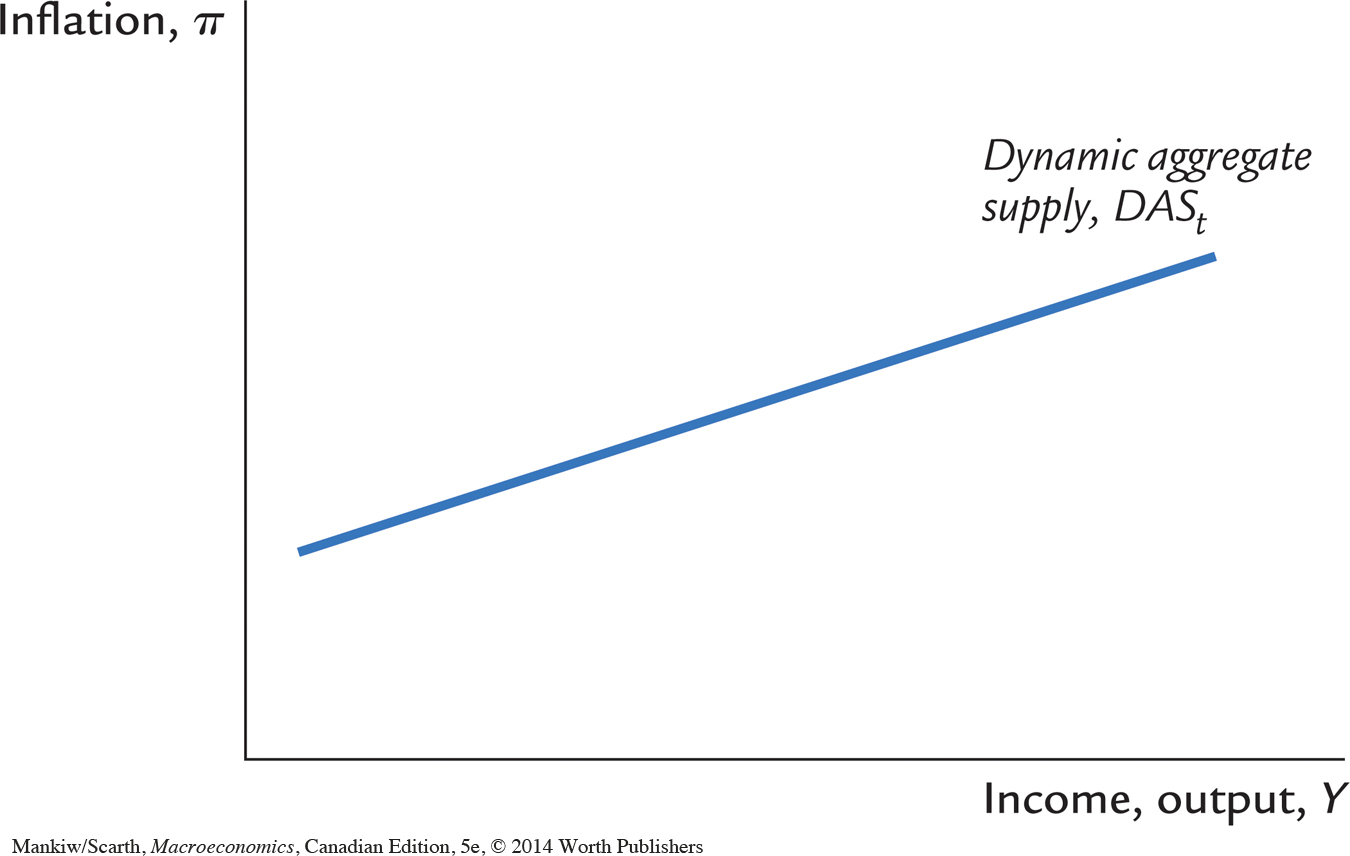 The Dynamic Aggregate Supply Curve The dynamic aggregate supply curve DASt shows a positive association between output Yt and inflation πt. Its upward slope reflects the Phillips curve relationship: Other things equal, high levels of economic activity are associated with high inflation. The dynamic aggregate supply curve is drawn for given values of past inflation πt–1, the natural level of output , and the supply shock vt. When these variables change, the curve shifts.