FIGURE 14-3
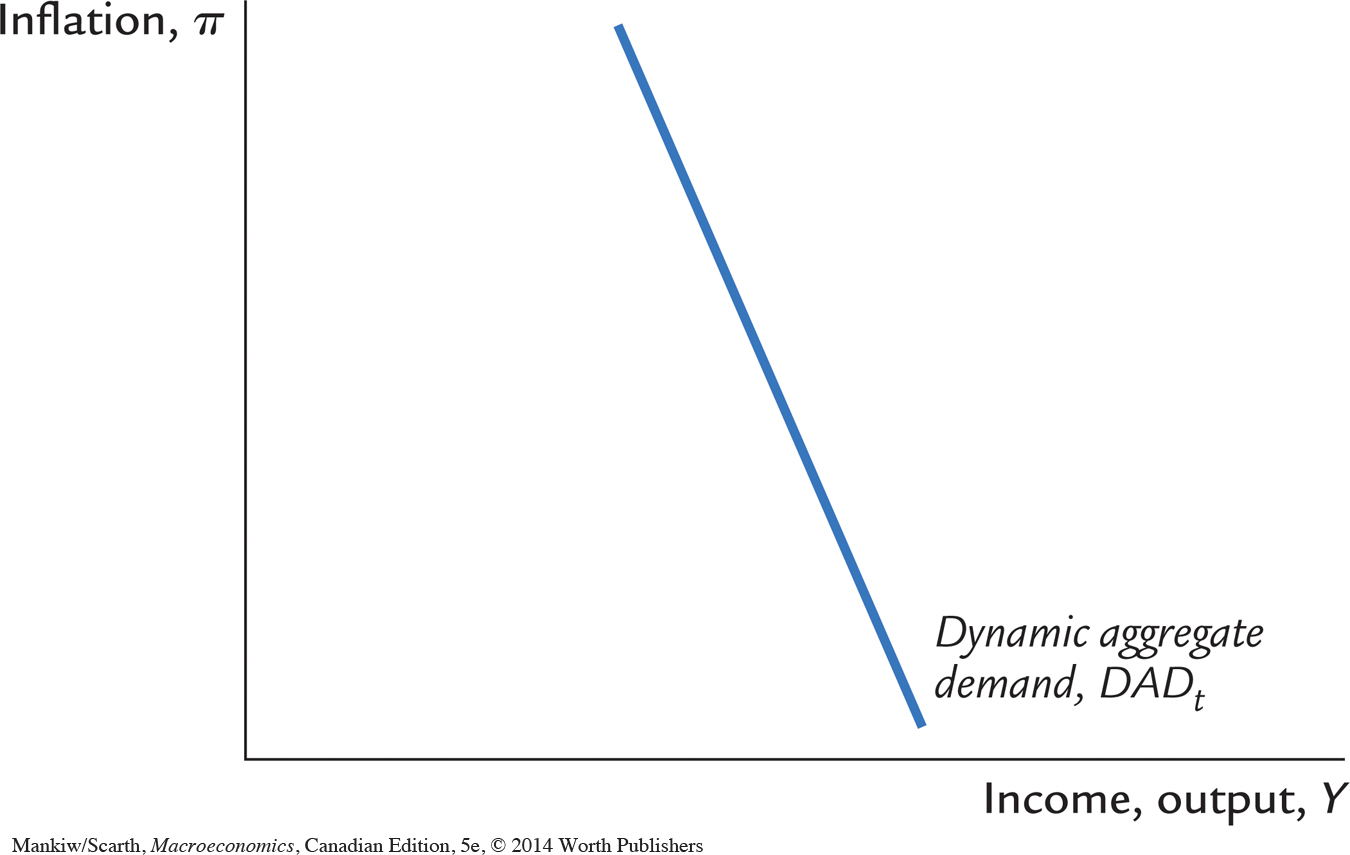 The Dynamic Aggregate Demand Curve The dynamic aggregate demand curve shows a negative association between output and inflation. Its downward slope reflects monetary policy and the demand for goods and services: a high level of inflation causes the central bank to raise nominal and real interest rates, which in turn reduces the demand for goods and services. The dynamic aggregate demand curve is drawn for given values of the natural level of output , the inflation target πt*, and the demand shock ϵt. When these exogenous variables change, the curve shifts.