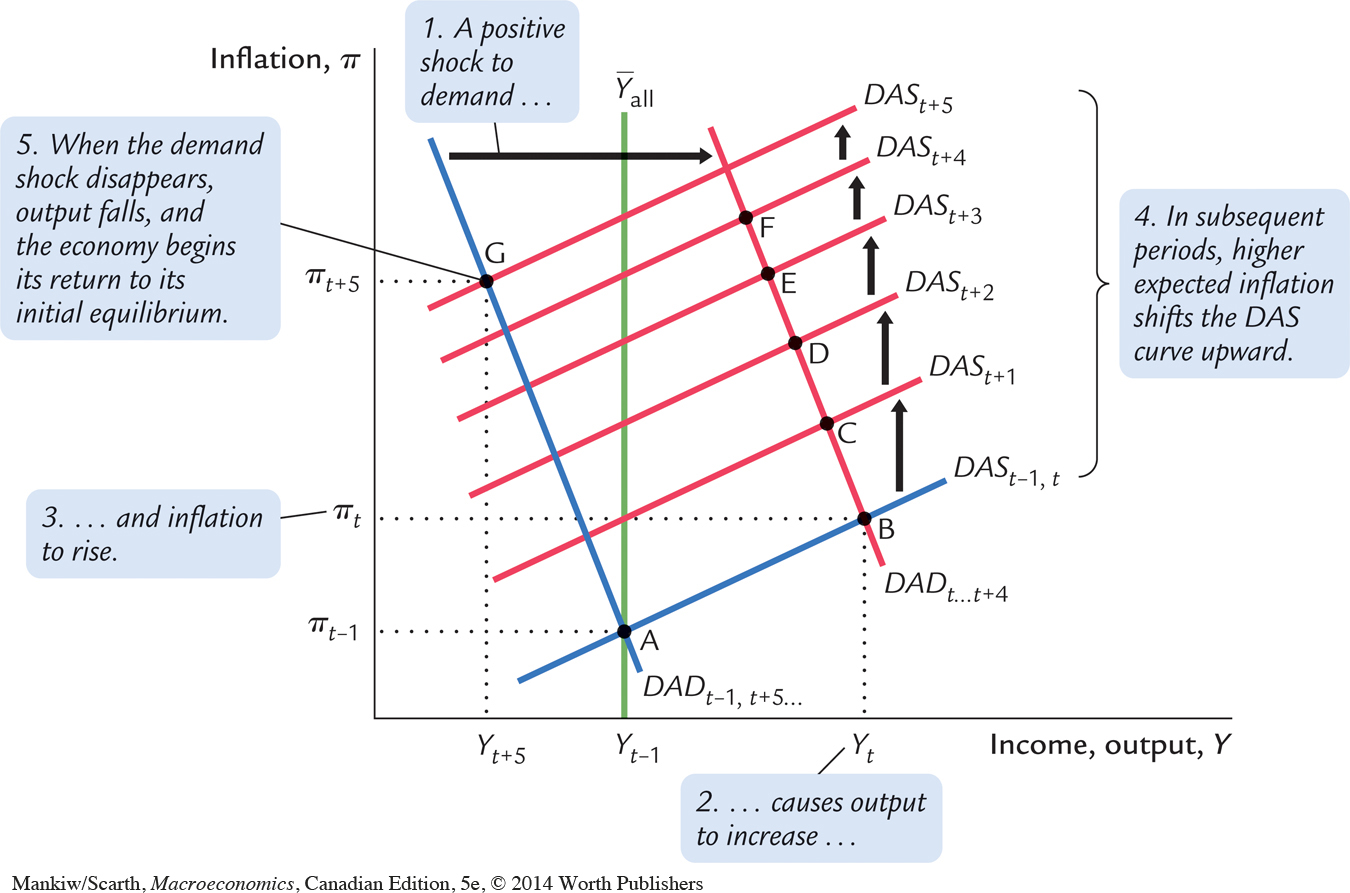
FIGURE 14-8
 A Demand Shock This figure shows the effects of a positive demand shock in period t that lasts for five periods. The shock immediately shifts the dynamic aggregate demand curve to the right from DADt–1 to DADt. The economy moves from point A to point B. Both inflation and output rise. In the next period, the dynamic aggregate supply curve shifts to DASt+1 because of increased expected inflation. The economy moves from point B to point C, and then in subsequent periods to points D, E, and F. When the demand shock disappears after five periods, the dynamic aggregate demand curve shifts back to its initial position, and the economy moves from point F to point G. Output falls below its natural level, and inflation starts to fall. Over time, the dynamic aggregate supply curve starts shifting downward, and the economy gradually returns to its initial equilibrium, point A.

