FIGURE 17-4
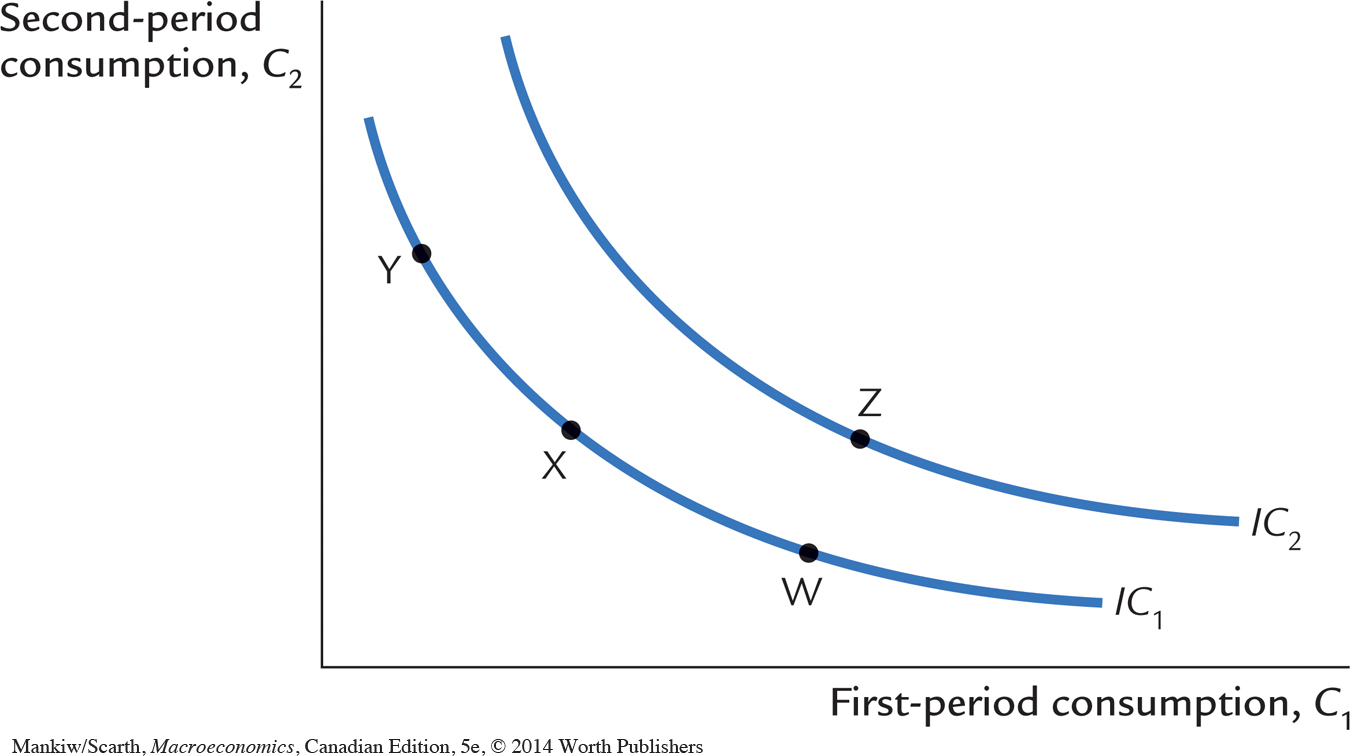 The Consumer’s Preferences Indifference curves represent the consumer’s preferences over first-period and second-period consumption. An indifference curve gives the combinations of consumption in the two periods that make the consumer equally happy. This figure shows two of many indifference curves. Higher indifference curves such as IC2 are preferred to lower curves such as IC1. The consumer is equally happy at points W, X, and Y, but prefers point Z to points W, X, or Y.