1.1 What Macroeconomists Study
Why have some countries experienced rapid growth in incomes over the past century while others stay mired in poverty? Why do some countries have high rates of inflation while others maintain stable prices? Why do all countries experience recessions and depressions—recurrent periods of falling incomes and rising unemployment—and how can government policy reduce the frequency and severity of these episodes? Macroeconomics, the study of the economy as a whole, attempts to answer these and many related questions.
To appreciate the importance of macroeconomics, you need only read the newspaper or listen to the news. Every day you can see headlines such as GDP GROWTH SLOWS, THE BANK OF CANADA MOVES TO COMBAT INFLATION, GOVERNMENT BUDGET INVOLVES RECORD DEFICIT, or STOCKS FALL AMID RECESSION FEARS. These macroeconomic events may seem abstract, but they touch all of our lives. Business executives forecasting the demand for their products must guess how fast consumers’ incomes will grow. Senior citizens living on fixed incomes wonder how fast prices will rise. Recent graduates looking for jobs hope that the economy will boom and that firms will be hiring.
Because the state of the economy affects everyone, macroeconomic issues play a central role in national political debates. Voters are keenly aware of how the economy is doing, and they know that government policy can affect the economy in powerful ways. As a result, the popularity of the government often rises when the economy is doing well and falls when it is doing poorly. During the federal election of 1993, for example, Liberal strategists kept the former government on the defensive by keeping the campaign focused on the economy. Every speech included the refrain “jobs, jobs, jobs.”
Macroeconomic issues are also at the center of world politics, and if you read the international news, you will quickly start thinking about a variety of macroeconomic questions. Was it a good move for much of Europe to adopt a common currency? Why did the Canadian dollar rise in recent months? Should China maintain a fixed exchange rate against the U.S. dollar? Why is the United States running large trade deficits? How can poor nations raise their standard of living? When world leaders meet, these topics are often high on their agenda.
4
Although the job of making economic policy belongs to world leaders, the job of explaining how the economy as a whole works falls to macroeconomists. Toward this end, macroeconomists collect data on incomes, prices, unemployment, and many other variables from different time periods and different countries. They then attempt to formulate general theories that help to explain these data. Like astronomers studying the evolution of stars or biologists studying the evolution of species, macroeconomists cannot conduct controlled experiments in a laboratory. Instead, they must make use of the data that history gives them. Macroeconomists observe that economies differ from one another and that they change over time. These observations provide both the motivation for developing macroeconomic theories and the data for testing them.
To be sure, macroeconomics is a young and imperfect science. The macroeconomist’s ability to predict the future course of economic events is no better than the meteorologist’s ability to predict next month’s weather. But, as you will see, macroeconomists know quite a lot about how economies work. Since the Canadian economy is a mixture of markets and government policy involvement, this knowledge is useful both for explaining economic events and for formulating economic policy.
Every era has its own economic problems. In the 1970s, the Liberal government of Pierre Trudeau wrestled in vain with a rising rate of inflation. In the 1980s, inflation subsided, but the Conservative government of Brian Mulroney continued to struggle with large federal budget deficits. In the 1990s, as the Liberals formed the government once again, the budget deficit shrank and even turned into a small budget surplus, but federal taxes as a share of national income reached a historic high. In the early years of the new century, the federal government became increasingly focused on how productivity growth might be stimulated, and on how the challenges of increased globalization and an aging population are to be met in the coming years. Then a major recession hit—a dramatic upheaval started by mortgage defaults and the bankruptcies of several major financial institutions in the United States. The final magnitude of the downturn was uncertain as this book was going to press, but some observers feared the recession might be deep. In some minds, the financial crisis raised the spectre of the Great Depression of the 1930s; in its worst year, one out of four Canadians who wanted to work could not find a job. In 2009, officials in the Bank of Canada lowered its trend-setting overnight interest rate essentially to zero, and the federal budget set a record deficit of $50 billion. Both of these actions were designed to prevent a recurrence of the 1930s outcome.
Macroeconomic history is not a simple story, but it provides a rich motivation for macroeconomic theory. Although the basic principles of macroeconomics do not change from decade to decade, the macroeconomist must apply these principles with flexibility and creativity to meet changing circumstances.
5
CASE STUDY
The Historical Performance of the Canadian Economy
Economists use many types of data to measure the performance of an economy. Three macroeconomic variables are particularly important: real gross domestic product (GDP), the inflation rate, and the unemployment rate. Real GDP measures the total income of everyone in the economy (adjusted for the level of prices). The inflation rate measures how quickly prices are rising. The unemployment rate measures the fraction of the labour force that is out of work. Macroeconomists study how these variables are determined, why they change over time, and how they interact with one another.
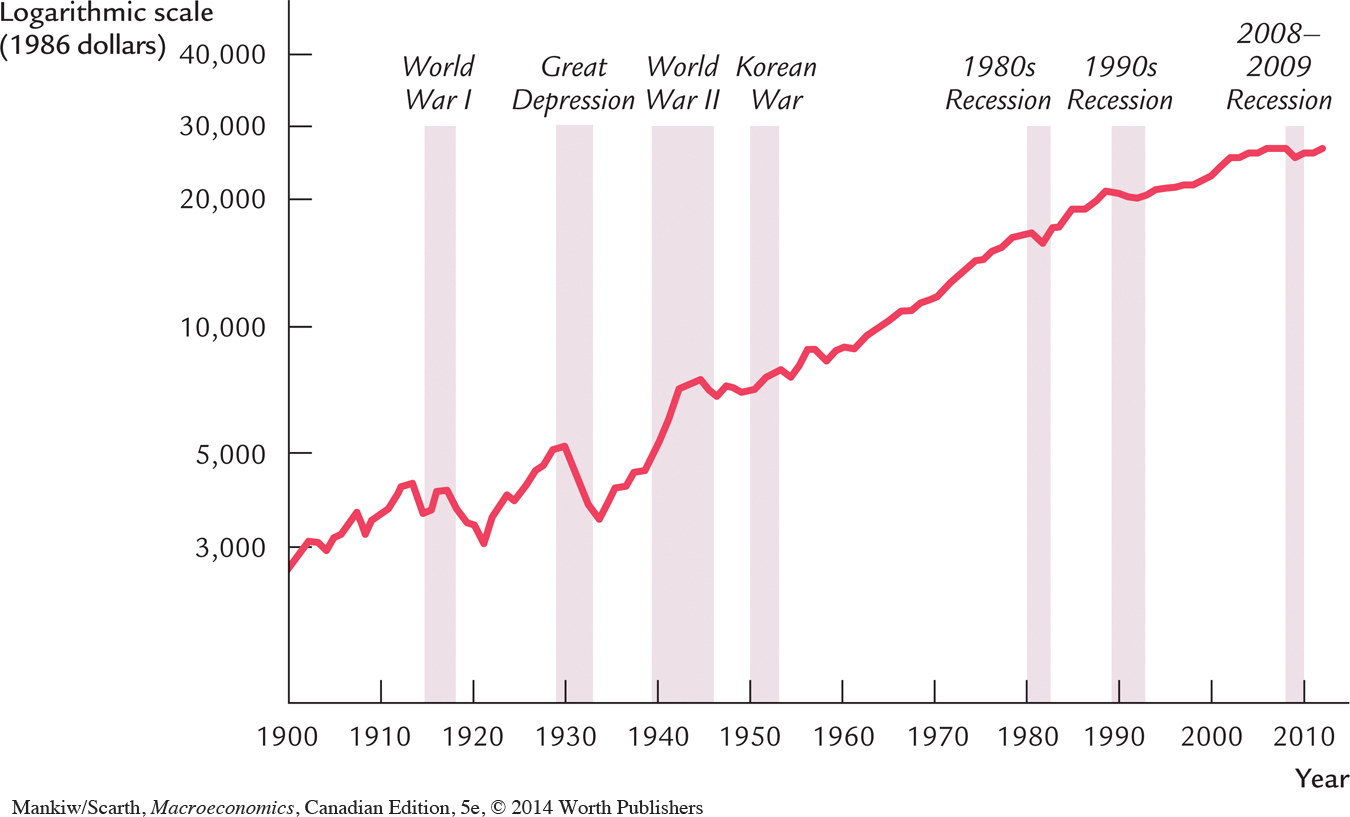
Figure 1-1 shows real GDP per person for the Canadian economy—widely regarded as a measure of our standard of living. Two aspects of this figure are noteworthy. First, real GDP grows over time. Measured in terms of 2008 market prices, real GDP per person today is about 42.2 thousand dollars—about eleven times its level in 1900. This growth in average income allows us to enjoy a much higher standard of living than our great-grandparents did. Second, although real GDP rises in most years, this growth is not steady. There are repeated periods during which real GDP is falling, a dramatic example being the 1930s. Such periods are called recessions if they are mild and depressions if they are more severe. Not surprisingly, periods of declining income are associated with substantial economic hardship.
6
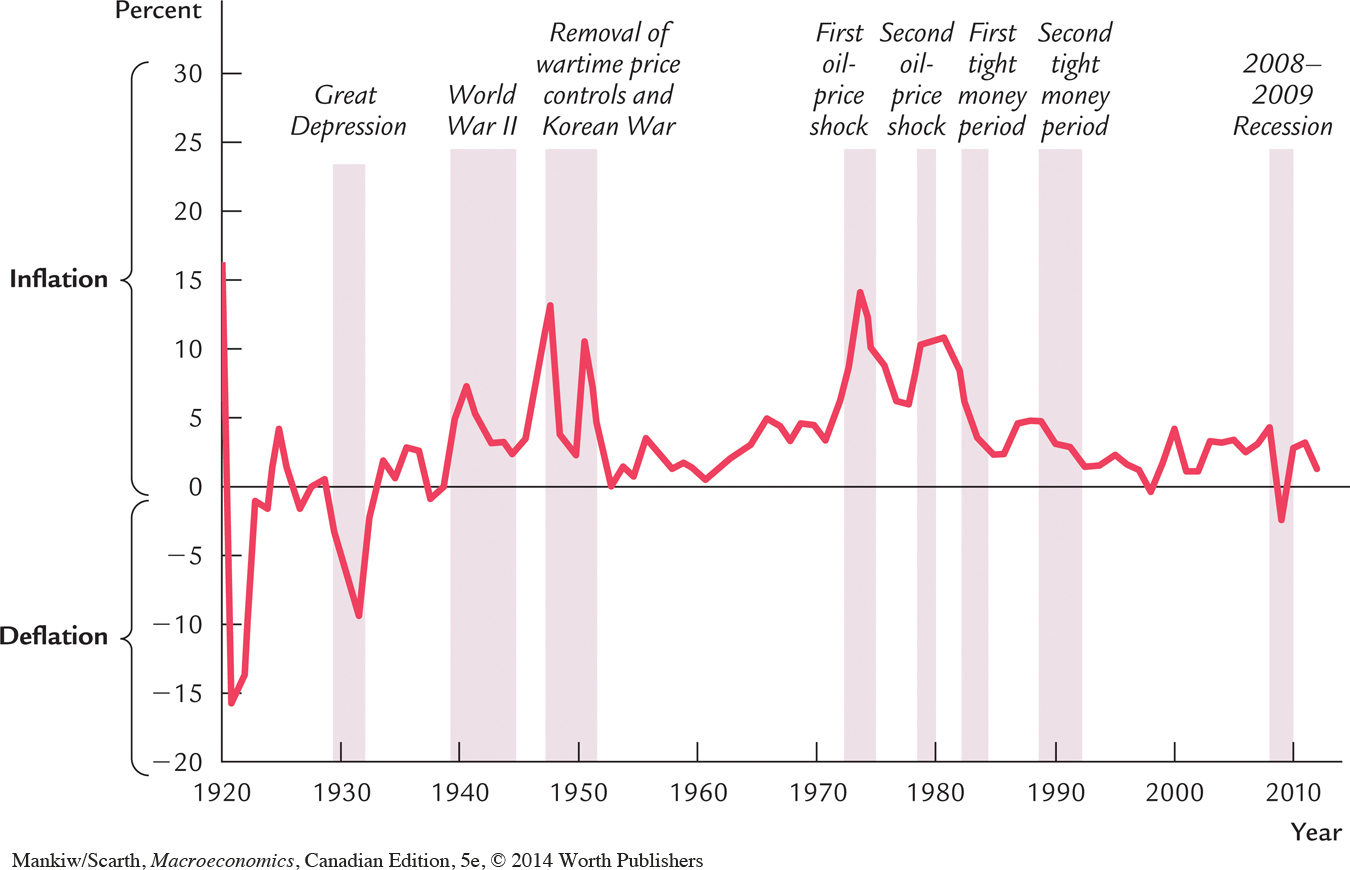
Figure 1-2 shows the Canadian inflation rate. You can see that inflation varies substantially. Before 1945, the inflation rate averaged about zero. Periods of falling prices, called deflation, were almost as common as periods of rising prices. In more recent history, inflation has been the norm. The inflation problem became most severe during the mid-1970s, when prices rose persistently at a rate of almost 10 percent per year. Inflation returned to near zero in the 1990s, started creeping up again, then dropped during the 2008 recession.
7
Figure 1-3 shows the Canadian unemployment rate since 1921, the first year for which data exist. This figure shows that there is always some unemployment and that the amount varies from year to year. Recessions and depressions are associated with unusually high unemployment. The highest rates of unemployment were reached during the Great Depression of the 1930s. As the figure shows, since World War II, there has been a gradual upward trend in unemployment. We will discuss the likely causes of this troubling fact in Chapter 6. Evidence for the last 15 years suggests that this disturbing trend may be starting to reverse itself.
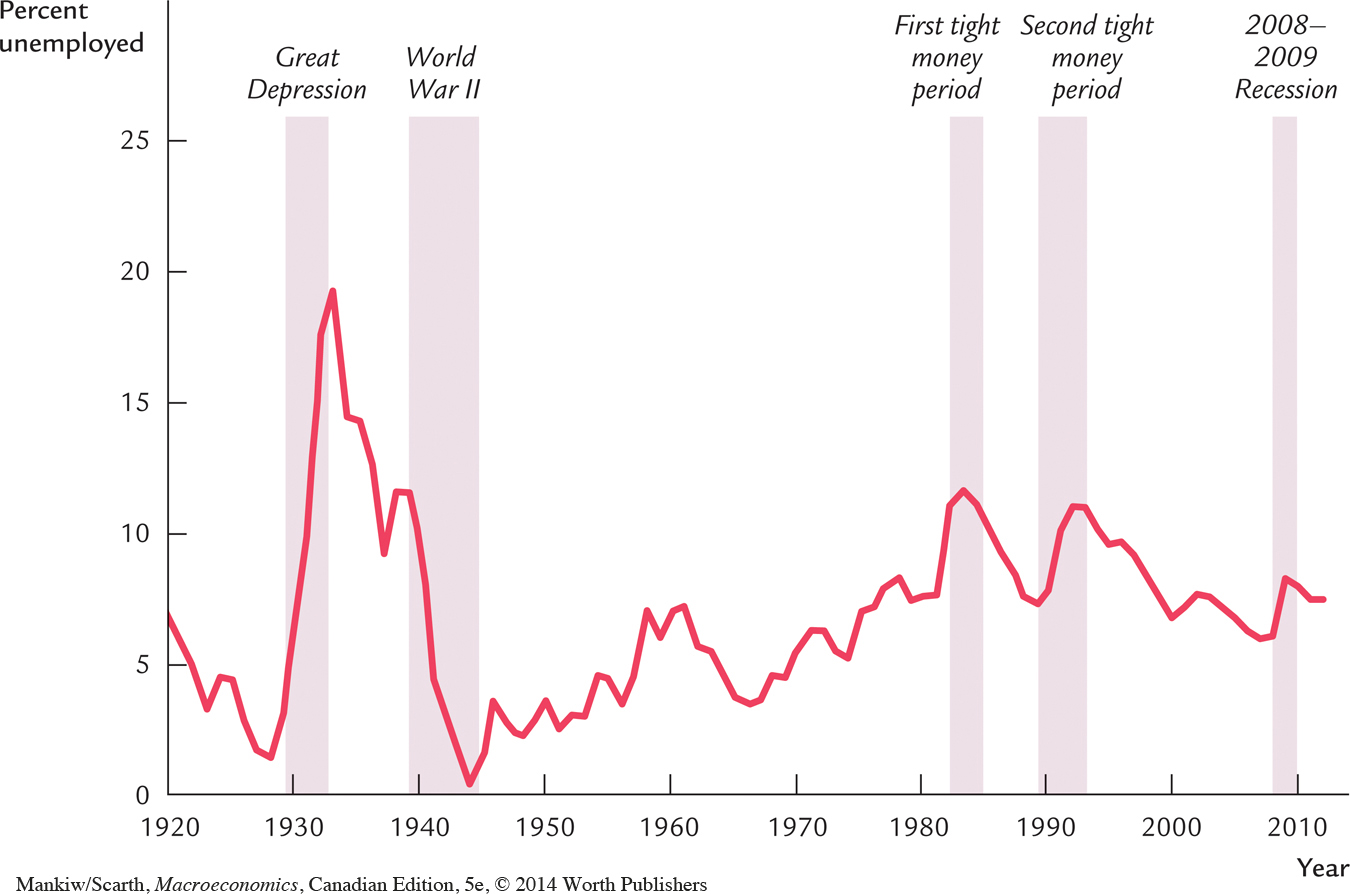
These three figures offer a glimpse at the history of the Canadian economy. They show that unemployment falls and inflation rises when total spending is high (such as during World War II and the early 1960s), and that unemployment rises when inflation is reduced by government policy that decreases total spending (such as during the early 1980s and 1990s).
In the chapters that follow, we first discuss how these variables are measured and then explain how they behave—of course, we will look at other data as well—such as the exchange rate, foreign trade and foreign debt—since international involvement is a key feature of the Canadian economy. We will then be in a position to evaluate the government’s fiscal policy (its changes in government spending and taxing) and its monetary policy (changes in the growth of the nation’s money supply).