1.2 How Economists Think
8
Although economists often study politically charged issues, they try to address these issues with a scientist’s objectivity. Like any science, economics has its own set of tools—terminology, data, and a way of thinking—that can seem foreign and arcane to the layman. The best way to become familiar with these tools is to practice using them, and this book will afford you ample opportunity to do so. To make these tools less forbidding, however, let’s discuss a few of them here.
Theory as Model Building
Young children learn much about the world around them by playing with toy versions of real objects. Often they put together models of, for instance, cars, trains, or planes. These models are far from realistic, but the model-builder learns a lot from them nonetheless. The model illustrates the essence of the real object it is designed to resemble. (In addition, for many children, building models is fun.)
Economists also use models to understand the world, but an economist’s model is more likely to be made of symbols and equations than plastic and glue. Economists build their “toy economies” to help explain economic variables, such as GDP, inflation, and unemployment. Economic models illustrate, often in mathematical terms, the relationships among the variables. Models are useful because they help us to dispense with irrelevant details and to focus on underlying connections more clearly. (In addition, for many economists, building models is fun.)
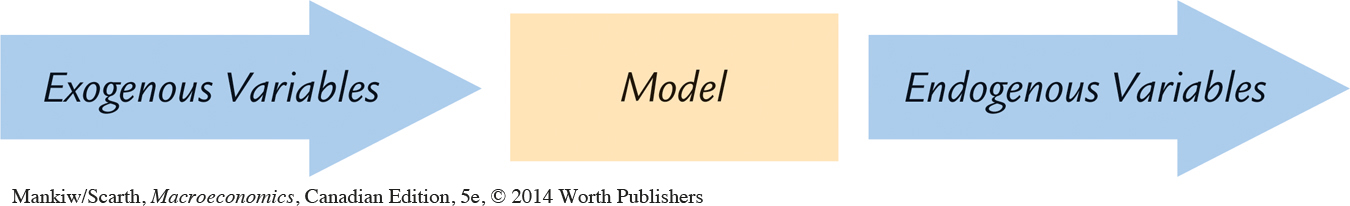
Models have two kinds of variables: endogenous variables and exogenous variables. Endogenous variables are those variables that a model tries to explain. Exogenous variables are those variables that a model takes as given. The purpose of a model is to show how the exogenous variables affect the endogenous variables. In other words, as Figure 1-4 illustrates, exogenous variables come from outside the model and serve as the model’s input, whereas endogenous variables are determined inside the model and are the model’s output.
To make these ideas more concrete, let’s review the most celebrated of all economic models—the model of supply and demand. Imagine that an economist wanted to figure out what influences the price of pizza and the quantity of pizza sold. He or she would proceed by developing a model that described the behaviour of pizza buyers, the behaviour of pizza sellers, and their interaction in the market for pizza. For example, the economist supposes that the quantity of pizza demanded by consumers Qd depends on the price of pizza P and on aggregate income Y. This relationship is expressed in the equation
9
Qd = D(P, Y ),
where D( ) represents the demand function. Similarly, the economist supposes that the quantity of pizza supplied by pizzerias Qs depends on the price of pizza P and on the price of materials Pm, such as cheese, tomatoes, flour, and anchovies. This relationship is expressed as
Qs = S(P, Pm),
where S( ) represents the supply function. Finally, the economist assumes that the price of pizza adjusts to bring the quantity supplied and quantity demanded into balance:
Qs = Qd.
These three equations compose a model of the market for pizza.
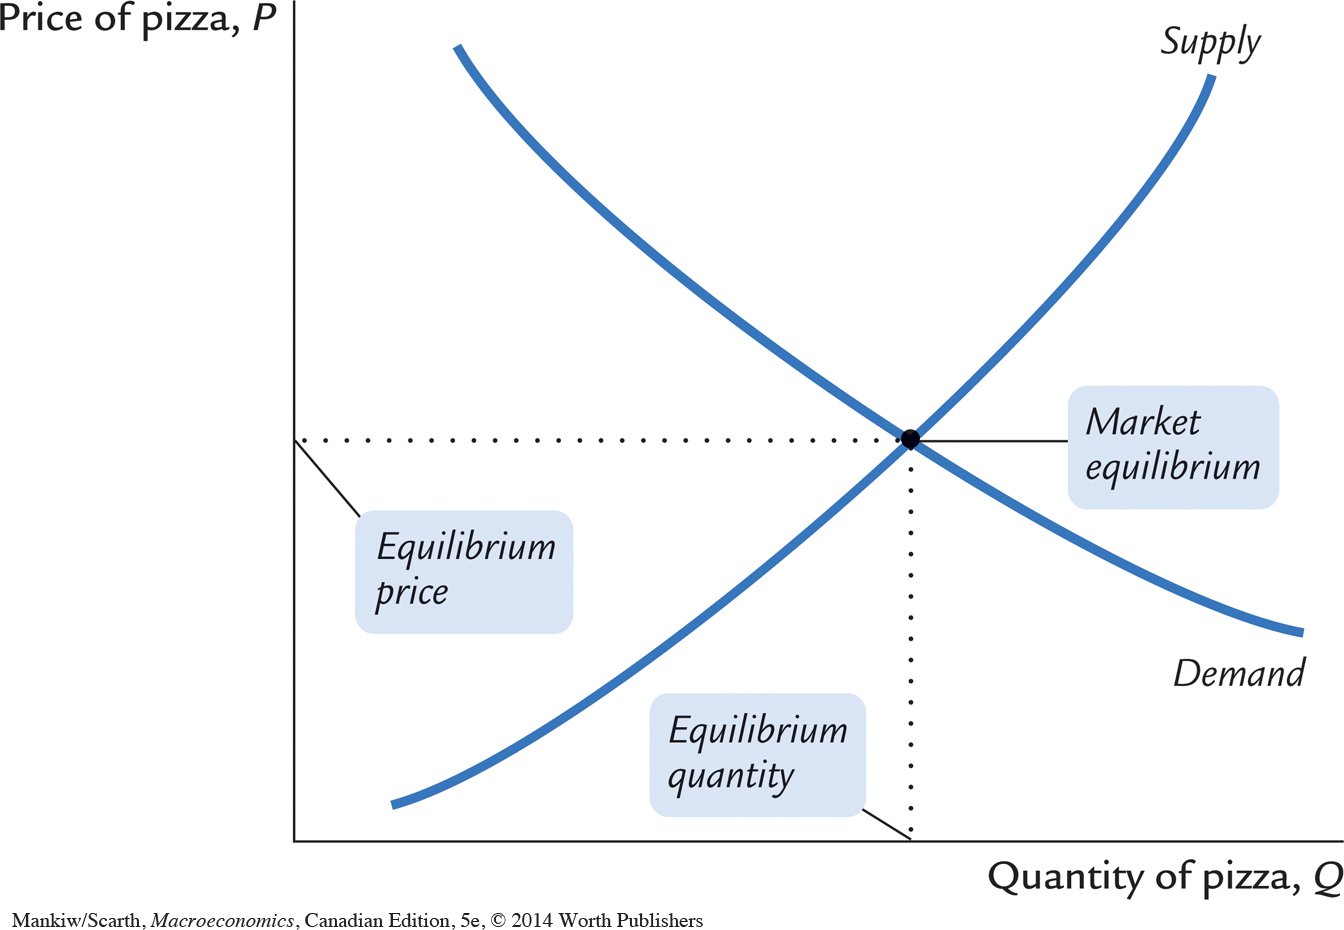
The economist illustrates the model with a supply-and-demand diagram, as in Figure 1-5. The demand curve shows the relationship between the quantity of pizza demanded and the price of pizza, holding aggregate income constant. The demand curve slopes downward because a higher price of pizza encourages consumers to switch to other foods and buy less pizza. The supply curve shows the relationship between the quantity of pizza supplied and the price of pizza, holding the price of materials constant. The supply curve slopes upward because a higher price of pizza makes selling pizza more profitable, which encourages pizzerias to incur the opportunity costs and produce more. The equilibrium for the market is the price and quantity at which the supply and demand curves intersect. At the equilibrium price, consumers choose to buy exactly the amount of pizza that pizzerias choose to produce.
This model of the pizza market has two exogenous variables and two endogenous variables. The exogenous variables are aggregate income and the price of materials. The model does not attempt to explain them but instead takes them as given (perhaps to be explained by another model). The endogenous variables are the price of pizza and the quantity of pizza exchanged. These are the variables that the model attempts to explain.
10
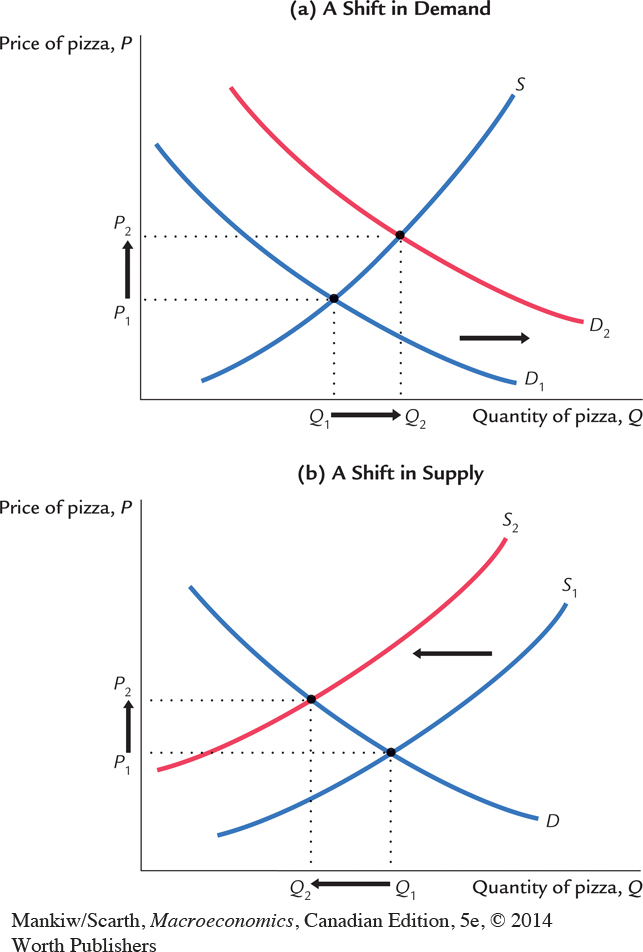
The model shows how a change in one of the exogenous variables affects both endogenous variables. For example, if aggregate income increases, then the demand for pizza increases, as in panel (a) of Figure 1-6. The model shows that both the equilibrium price and the equilibrium quantity of pizza rise. Similarly, if the price of materials increases, then the supply of pizza decreases, as in panel (b) of Figure 1-6. The model shows that in this case the equilibrium price of pizza rises and the equilibrium quantity of pizza falls. Thus, the model shows how changes either in aggregate income or in the price of materials affect price and quantity in the market for pizza.
Like all models, this model of the pizza market makes many simplifying assumptions. The model does not take into account, for example, that every pizzeria is in a different location. For each customer, one pizzeria is more convenient than the others, and thus pizzerias have some ability to set their own prices. Although the model assumes that there is a single price for pizza, in fact there could be a different price at every pizzeria.
How should we react to the model’s lack of realism? Should we discard the simple model of pizza supply and demand? Should we attempt to build a more complex model that allows for diverse pizza prices? The answers to these questions depend on our purpose. If our goal is to explain how the price of cheese affects the average price of pizza and the amount of pizza sold, then the diversity of pizza prices is probably not important. The simple model of the pizza market does a good job of addressing that issue. Yet if our goal is to explain why towns with three pizzerias have lower pizza prices than towns with one pizzeria, the simple model is less useful.
11
The art in economics is in judging when a simplifying assumption (such as assuming a single price of pizza) clarifies our thinking and when it misleads us. Simplification is a necessary part of building a useful model: any model constructed to be completely realistic would be too complicated for anyone to understand. Yet models lead to incorrect conclusions if they assume away features of the economy that are crucial to the issue at hand. Economic modeling therefore requires care and common sense.
12
FYI
Using Functions to Express Relationships Among Variables
All economic models express relationships among economic variables. Often, these relationships are expressed as functions. A function is a mathematical concept that shows how one variable depends on a set of other variables. For example, in the model of the pizza market, we said that the quantity of pizza demanded depends on the price of pizza and on aggregate income. To express this, we use functional notation to write
Qd = D(P, Y).
This equation says that the quantity of pizza demanded Qd is a function of the price of pizza P and aggregate income Y. In functional notation, the variable preceding the parentheses denotes the function. In this case, D( ) is the function expressing how the variables in parentheses determine the quantity of pizza demanded.
If we knew more about the pizza market, we could give a numerical formula for the quantity of pizza demanded. For example, we might be able to write
Qd = 60 – 10P + 2Y.
In this case, the demand function is
D(P, Y) = 60 – 10P + 2Y.
For any price of pizza and aggregate income, this function gives the corresponding quantity of pizza demanded. For example, if aggregate income is $10 and the price of pizza is $2, then the quantity of pizza demanded is 60 pies; if the price of pizza rises to $3, the quantity of pizza demanded falls to 50 pies.
Functional notation allows us to express the general idea that variables are related even when we do not have enough information to indicate the precise numerical relationship. For example, we might know that the quantity of pizza demanded falls when the price rises from $2 to $3, but we might not know by how much it falls. In this case, functional notation is useful: as long as we know that a relationship among the variables exists, we can remind ourselves of that relationship using functional notation.
The Use of Multiple Models
Macroeconomists study many facets of the economy. For example, they examine the influence of fiscal policy on economic growth, the impact of employment insurance on the unemployment rate, the effect of inflation on interest rates, and the influence of trade policy on the exchange rate.
Although economists use models to address all these issues, no single model can answer all questions. Just as carpenters use different tools for different tasks, economists uses different models to explain different economic phenomena. Students of macroeconomics, therefore, must keep in mind that there is no single “correct” model that is universally applicable. Instead, there are many models, each of which is useful for shedding light on a different facet of the economy. The field of macroeconomics is like a Swiss army knife—a set of complementary but distinct tools that can be applied in different ways in different circumstances.
This book therefore presents many different models that address different questions and that make different assumptions. Remember that a model is only as good as its assumptions and that an assumption that is useful for some purposes may be misleading for others. When using a model to address a question, the economist must keep in mind the underlying assumptions and judge whether these are reasonable for studying the matter at hand.
Prices: Flexible Versus Sticky
13
Throughout this book, one group of assumptions will prove especially important—those concerning the speed with which wages and prices adjust to changing economic conditions. Economists normally presume that the price of a good or a service moves quickly to bring quantity supplied and quantity demanded into balance. In other words, they assume that markets are normally in equilibrium, so the price of any good or service is found where the supply and demand curves intersect. This assumption is called market clearing and is central to the model of the pizza market discussed earlier. For answering most questions, economists use market-clearing models.
Yet the assumption of continuous market clearing is not entirely realistic. For markets to clear continuously, prices must adjust instantly to changes in supply and demand. In fact, many wages and prices adjust slowly. Labour contracts often set wages for up to three years. Many firms leave their product prices the same for long periods of time—for example, magazine publishers typically change their newsstand prices only every three or four years. Although market-clearing models assume that all wages and prices are flexible, in the real world some wages and prices are sticky.
The apparent stickiness of prices does not necessarily make market-clearing models useless. After all, prices are not stuck forever; eventually, they do adjust to changes in supply and demand. Market-clearing models might not describe the economy at every instant, but they do describe the equilibrium toward which the economy slowly gravitates. Therefore, most macroeconomists believe that price flexibility is a good assumption for studying long-run issues, such as the growth in real GDP that we observe from decade to decade.
For studying short-run issues, such as year-to-year fluctuations in real GDP and unemployment, the assumption of price flexibility is less plausible. Over short periods, many prices are fixed at predetermined levels. Therefore, most macroeconomists believe that price stickiness is a better assumption for studying the short-run behaviour of the economy.
14
FYI
Nobel Macroeconomists
The Nobel Prize in economics is announced every October. Many winners have been macroeconomists whose work we study in this book. Here are a few of them, along with some of their own words about how they chose their field of study:
Milton Friedman (Nobel 1976): “I graduated from college in 1932, when the United States was at the bottom of the deepest depression in its history before or since. The dominant problem of the time was economics. How to get out of the depression? How to reduce unemployment? What explained the paradox of great need on the one hand and unused resources on the other? Under the circumstances, becoming an economist seemed more relevant to the burning issues of the day than becoming an applied mathematician or an actuary.”
James Tobin (Nobel 1981): “I was attracted to the field for two reasons. One was that economic theory is a fascinating intellectual challenge, on the order of mathematics or chess. I liked analytics and logical argument…. The other reason was the obvious relevance of economics to understanding and perhaps overcoming the Great Depression.”
Franco Modigliani (Nobel 1985): “For awhile it was thought that I should study medicine because my father was a physician…. I went to the registration window to sign up for medicine, but then I closed my eyes and thought of blood! I got pale just thinking about blood and decided under those conditions I had better keep away from medicine…. Casting about for something to do, I happened to get into some economics activities. I knew some German and was asked to translate from German into Italian some articles for one of the trade associations. Thus I began to be exposed to the economic problems that were in the German literature.”
Robert Solow (Nobel 1987): “I came back [to college after being in the army] and, almost without thinking about it, signed up to finish my undergraduate degree as an economics major. The time was such that I had to make a decision in a hurry. No doubt I acted as if I were maximizing an infinite discounted sum of one-period utilities, but you couldn’t prove it by me. To me it felt as if I were saying to myself: ‘What the hell.’”
Robert Lucas (Nobel 1995): “In public school science was an unending and not very well organized list of things other people had discovered long ago. In college, I learned something about the process of scientific discovery, but what I learned did not attract me as a career possibility…. What I liked thinking about were politics and social issues.”
George Akerlof (Nobel 2001): “When I went to Yale, I was convinced that I wanted to be either an economist or an historian. Really, for me it was a distinction without a difference. If I was going to be an historian, then I would be an economic historian. And if I was to be an economist I would consider history as the basis for my economics.”
Edward Prescott (Nobel 2004): “Through discussion with [my father], I learned a lot about the way businesses operated. This was one reason why I liked my microeconomics course so much in my first year at Swarthmore College. The price theory that I learned in that course rationalized what I had learned from him about the way businesses operate. The other reason was the textbook used in that course, Paul A. Samuelson’s Principles of Economics. I loved the way Samuelson laid out the theory in his textbook, so simply and clearly.”
Robert Mundell (Nobel 1999), who was an undergraduate at the University of British Columbia, is one of the two Canadians to win the prize in economics. (The other was Myron Scholes, an undergraduate at McMaster, who won for his work on finance in 1997.) In his Nobel-prize interview, Mundell noted the importance of his Canadian background for his career. Canada was the first country to drop controls that limit the flow of capital across borders, and to have a flexible exchange rate— during the 1950s. These developments motivated Mundell to construct macroeconomic models based on the assumption of international capital mobility. This work was recognized as the important analytical base for the development of more recent work on the implications of “globalization”.
Edmund Phelps (Nobel 2006): “Like most Americans entering college, I started at Amherst College without a predetermined course of study or without even a career goal. My tacit assumption was that I would drift into the world of business—of money, doing something terribly smart. In the first year, though, I was awestruck by Plato, Hume and James. I would probably have gone into philosophy were it not that my father cajoled and pleaded with me to try a course in economics, which I did the second year…. I was hugely impressed to see that it was possible to subject the events in those newspapers I had read about to a formal sort of analysis.”
If you want to learn more about the Nobel Prize and its winners, go to www.nobelprize.org.1
Microeconomic Thinking and Macroeconomic Models
15
Microeconomics is the study of how households and firms make decisions and how these decisionmakers interact in the marketplace. A central principle of microeconomics is that households and firms optimize—they do the best they can for themselves given their objectives and the constraints they face. In microeconomic models, households choose their purchases to maximize their level of satisfaction, which economists call utility, and firms make production decisions to maximize their profits.
Because economy-wide events arise from the interaction of many households and firms, macroeconomics and microeconomics are inextricably linked. When we study the economy as a whole, we must consider the decisions of individual economic actors. For example, to understand what determines total consumer spending, we must think about a family deciding how much to spend today and how much to save for the future. To understand what determines total investment spending, we must think about a firm deciding whether to build a new factory. Because aggregate variables are simply the sum of the variables describing many individual decisions, macroeconomic theory inevitably rests on a microeconomic foundation.
Although microeconomic decisions underlie all economic models, in many models the optimizing behaviour of households and firms is implicit rather than explicit. The model of the pizza market we discussed earlier is an example. Households’ decisions about how much pizza to buy underlie the demand for pizza, and pizzerias’ decisions about how much pizza to produce underlie the supply of pizza. Presumably, households make their decisions to maximize utility, and pizzerias make their decisions to maximize profit. Yet the model does not focus on how these microeconomic decisions are made; instead, it leaves these decisions in the background. Similarly, although microeconomic decisions lie behind all macroeconomic phenomena, macroeconomic models do not necessarily focus on the optimizing behaviour of households and firms but, instead, sometimes leave that behaviour in the background.