2.2 Measuring the Cost of Living: The Consumer Price Index
A dollar today doesn’t buy as much as it did twenty years ago. The cost of almost everything has gone up. This increase in the overall level of prices is called inflation, and it is one of the primary concerns of economists and policymakers. In later chapters we examine in detail the causes and effects of inflation. Here we discuss how economists measure changes in the cost of living.
The Price of a Basket of Goods
The most commonly used measure of the level of prices is the consumer price index (CPI). Statistics Canada has the job of computing the CPI. It begins by collecting the prices of thousands of goods and services. Just as GDP turns the quantities of many goods and services into a single number measuring the value of production, the CPI turns the prices of many goods and services into a single index measuring the overall level of prices.
35
How should economists aggregate the many prices in the economy into a single index that reliably measures the price level? They could simply compute an average of all prices. Yet this approach would treat all goods and services equally. Because people buy more chicken than caviar, the price of chicken should have a greater weight in the CPI than the price of caviar. Statistics Canada weights different items by computing the price of a basket of goods and services purchased by a typical consumer. The CPI is the price of this basket of goods and services relative to the price of the same basket in some base year.
For example, suppose that the typical consumer buys 5 apples and 2 oranges every month. Then the basket of goods consists of 5 apples and 2 oranges, and the CPI is

In this CPI, as in Canada at the time this book went to press, 2002 is the base year. The index tells us how much it costs now to buy 5 apples and 2 oranges relative to how much it cost to buy the same basket of fruit in 2002.
The consumer price index is the most closely watched index of prices, but it is not the only such index. Another is the producer price index, which measures the price of a typical basket of goods bought by firms rather than consumers. In addition to these overall price indices, Statistics Canada computes price indices for specific types of goods, such as food, housing, and energy, and for different cities in Canada. Another statistic, sometimes called core inflation and often a focus of the Bank of Canada in its Monetary Policy Reports, measures the increase in price of a consumer basket that excludes food and energy products. Because food and energy prices exhibit substantial short-run volatility, core inflation is sometimes viewed as a better gauge of ongoing inflation trends.
The CPI Versus the GDP Deflator
Earlier in this chapter we saw another measure of prices—the implicit price deflator for GDP, which is the ratio of nominal GDP to real GDP. The GDP deflator and the CPI give somewhat different information about what’s happening to the overall level of prices in the economy. There are three key differences between the two measures.
The first difference is that the GDP deflator measures the prices of all goods and services produced, whereas the CPI measures the prices of only the goods and services bought by consumers. Thus, an increase in the price of goods bought by firms or the government will show up in the GDP deflator but not in the CPI.
The second difference is that the GDP deflator includes only those goods produced domestically. Imported goods are not part of GDP and do not show up in the GDP deflator. Hence, an increase in the price of a Volkswagen made in Germany and sold in this country affects the CPI, because the Volkswagen is bought by consumers, but it does not affect the GDP deflator.
36
The third and most subtle difference results from the way the two measures aggregate the many prices in the economy. The CPI assigns fixed weights to the prices of different goods, whereas the GDP deflator assigns changing weights. In other words, the CPI is computed using a fixed basket of goods, whereas the GDP deflator allows the basket of goods to change over time as the composition of GDP changes. The following example shows how these approaches differ. Suppose that major frosts arrive early and destroy the nation’s crop of apples. The quantity of apples produced falls to zero, and the price of the few apples that remain on grocers’ shelves is driven sky-high. Because apples are no longer part of GDP, the increase in the price of apples does not show up in the GDP deflator. But because the CPI is computed with a fixed basket of goods that includes apples, the increase in the price of apples causes a substantial rise in the CPI.
Economists call a price index with a fixed basket of goods a Laspeyres index and a price index with a changing basket a Paasche index. Economic theorists have studied the properties of these different types of price indices to determine which is a better measure of the cost of living. The answer, it turns out, is that neither is clearly superior. When prices of different goods are changing by different amounts, a Laspeyres (fixed basket) index tends to overstate the increase in the cost of living because it does not take into account that consumers have the opportunity to substitute less expensive goods for more expensive ones. By contrast, a Paasche (changing basket) index tends to understate the increase in the cost of living. While it accounts for the substitution of alternative goods, it does not reflect the reduction in consumers’ welfare that may result from such substitutions.
The example of the destroyed apple crop shows the problems with Laspeyres and Paasche price indices. Because the CPI is a Laspeyres index, it overstates the impact of the increase in apple prices on consumers: by using a fixed basket of goods, it ignores consumers’ ability to substitute other foods for apples. By contrast, because the GDP deflator is a Paasche index, it understates the impact on consumers: the GDP deflator shows no rise in prices, yet surely the higher price of apples makes consumers worse off.3
3 Because a Laspeyres index overstates inflation and a Paasche index understates inflation, one might strike a compromise by taking an average of the two measured rates of inflation. This is the approach taken by another type of index, called a Fisher index. In this case, the average is the square root of the product of the two measured rates.
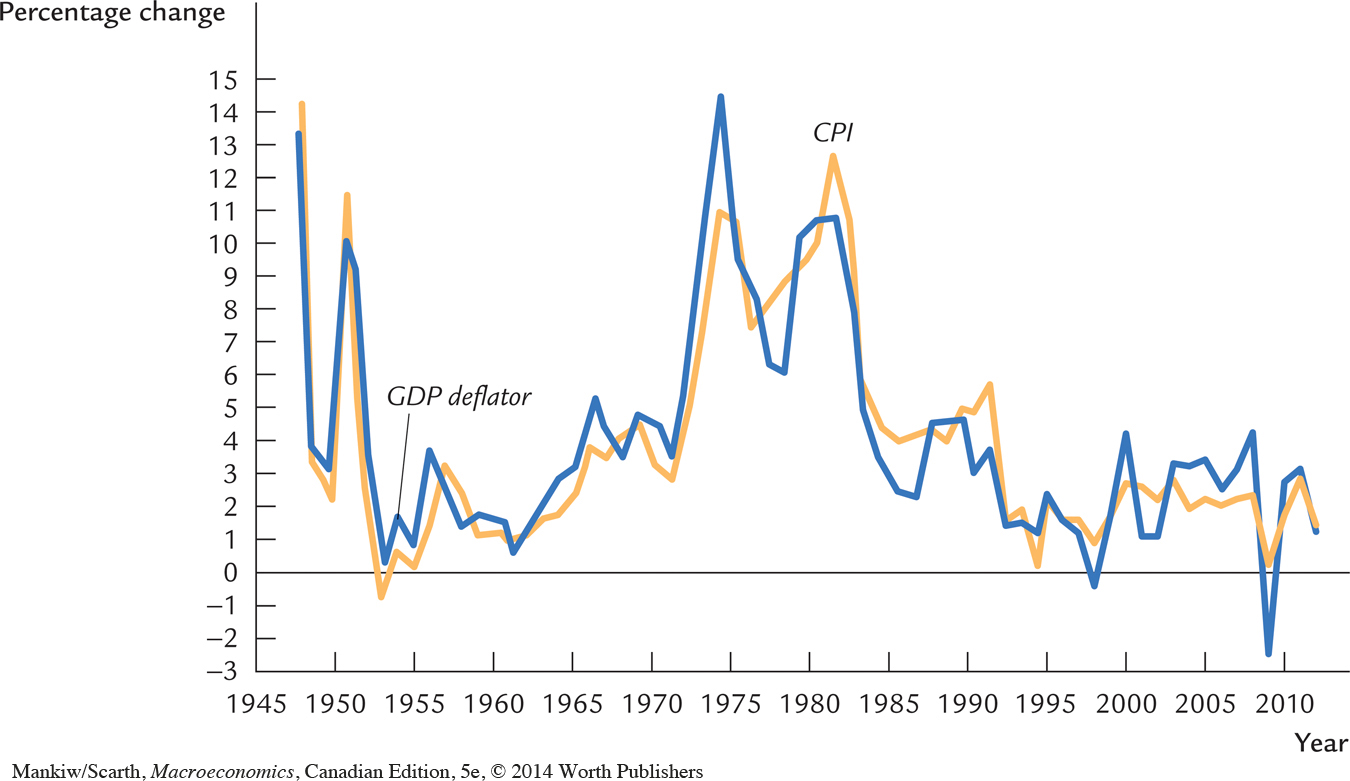
Luckily, the difference between the GDP deflator and the CPI is usually not large in practice. Figure 2-3 shows the percentage change in the GDP deflator and the percentage change in the CPI for each year since 1948. Both measures usually tell the same story about how quickly prices are rising. To learn about the tracking of Internet transactions, which provides timely information on prices at a fraction of the cost of traditional data-gathering methods, see the PriceStats website: www.pricestats.com.
37
CASE STUDY
Difficulties in Measuring Inflation
From 1973 to 1976 prices in Canada rose at a very rapid pace. But exactly how much did they rise? This question was asked by public policymakers who had to judge the seriousness of the inflation problem. It was also asked by private decisionmakers: many private contracts, such as wage agreements and pensions, are indexed to correct for the effects of rising prices.
The magnitude of the price rise depends on which measure of prices one uses. According to the GDP deflator, prices rose an average of 10.5 percent per year during these four years. According to the CPI, prices rose 9.2 percent per year. Over the four-year period, the accumulated difference is over 5 percent.
This discrepancy is partly attributable to the large increase in the price of natural resources that occurred in the mid-1970s. A significant part of the Canadian economy involves primary commodity industries. As a result, big price increases in these commodities make a significant contribution to the overall inflation rate as measured by the GDP deflator. But since households spend a lower proportion of their incomes on these products, natural resource price increases have a smaller impact on inflation as measured by the CPI.
38
A similar discrepancy between the two price indices emerged in the early 1990s and in the 2002–2005 periods. In the 1990s, the relative prices for primary commodities had fallen to their lowest levels in 60 years. This development, which was particularly hard on many individuals, such as western farmers, caused the GDP deflator to increase at a slower rate than the CPI. During the 1990–1994 period, the cumulative difference in the two measures was 6 percent. The cummulative difference (in the other direction) in the 2003–2005 period was 2.5 percent. This excess of the GDP deflator inflation rate over the CPI inflation rate has widened again in recent years. The recession in 2008–2009 led to even lower CPI inflation, but since world oil prices were rising noticeably, and since a significant fraction of Canada’s GDP is derived from the oil sector, the GDP inflation rate was 2.7 percentage points higher in 2008 alone.
When price indices differ, as they did during these episodes of commodity price volatility, it is usually possible to identify the sources of the differences. Yet accounting for the differences is easier than deciding which index provides the better measure. Furthermore, which index one should use in practice is not merely a question of measurement; it also depends on one’s purpose. In practice, government programs and private contracts usually use the CPI to measure the level of prices, despite the fact that we know the CPI is biased in the upward direction. The range of magnitude of that upward bias is about one-half of one percentage point to one percentage point.4 Thus, we should interpret an annual inflation rate for the CPI in this range as evidence that we have reached “zero” inflation. 
4 Allan Crawford, “Measuring Biases in the Canadian CPI,” in Bank of Canada Technical Report No. 64(1993), and Pierre Fortin, “Do We Measure Inflation Correctly?” in Zero Inflation: The Goal of Price Stability, R.G. Lipsey, ed. (Toronto: C.D. Howe Institute, 1990).
In addition to the substitution bias, a second problem is the introduction of new goods. When a new good is introduced into the marketplace, consumers are better off, because they have more products from which to choose. In effect, the introduction of new goods increases the real value of the dollar. Yet this increase in the purchasing power of the dollar is not reflected in a lower CPI.
A third problem is unmeasured changes in quality. When a firm changes the quality of a good it sells, not all of the good’s price change reflects a change in the cost of living. Statistics Canada does its best to account for changes in the quality of goods over time. For example, with computers, it is possible to make some adjustment for the increase in speed and memory over time. But for other products this is less easy to do. For instance, if Ford increases the horsepower of a particular car model from one year to the next, the CPI will reflect the change: the quality-adjusted price of the car will not rise as fast as the unadjusted price. Yet many changes in quality, such as comfort or safety, are hard to measure. If unmeasured quality improvement (rather than unmeasured quality deterioration) is typical, then the measured CPI rises faster than it should.