2.3 Measuring Joblessness: The Unemployment Rate
39
One aspect of economic performance is how well an economy uses its resources. Because an economy’s workers are its chief resource, keeping workers employed is a paramount concern of economic policymakers. The unemployment rate is the statistic that measures the percentage of those people wanting to work who do not have jobs. Some employment occurs because of friction in labour markets. For example, there are job vacancies in Alberta, but the unemployed in Newfoundland cannot take advantage of this fact. This sort of unemployment is often called structural. But some unemployment is cyclical; it occurs when the overall level of economic activity is insufficient to employ all those wanting work. The measured unemployment rate includes both structural and cyclical components.
Every month Statistics Canada computes the unemployment rate and many other statistics with which economists and policymakers monitor developments in the labour market. These statistics come from the Labour Force Survey of about 56,000 households. Based on the responses to survey questions, each adult (15 years and older) in each household is placed into one of three categories: employed, unemployed, or not in the labour force. A person is employed if he or she spent most of the previous week working at a paid job, as opposed to keeping house, going to school, or doing something else. A person is unemployed if he or she is not employed and is waiting for the start date of a new job, is on temporary layoff, or has been looking for a job. A person who fits into neither of the first two categories, such as a full-time student or retiree, is not in the labour force. A person who wants a job but has given up looking—a discouraged worker—is counted as not being in the labour force.
The labour force is defined as the sum of the employed and unemployed, and the unemployment rate is defined as the percentage of the labour force that is unemployed. That is,
Labour Force = Number of Employed + Number of Unemployed,
and

40
A related statistic is the labour-force participation rate, the percentage of the adult population that is in the labour force:

Statistics Canada computes these statistics for the overall population and for groups within the population: men and women, teenagers and prime-age workers.
Figure 2-4 shows the breakdown of the population into the three categories for 2012. The statistics broke down as follows:
Labour Force = 17.51 + 1.37 = 18.88 million.
Unemployment Rate = (1.37/18.88) × 100 = 7.3%.
Labour-Force Participation Rate = (18.88/28.32) × 100 = 66.7%.
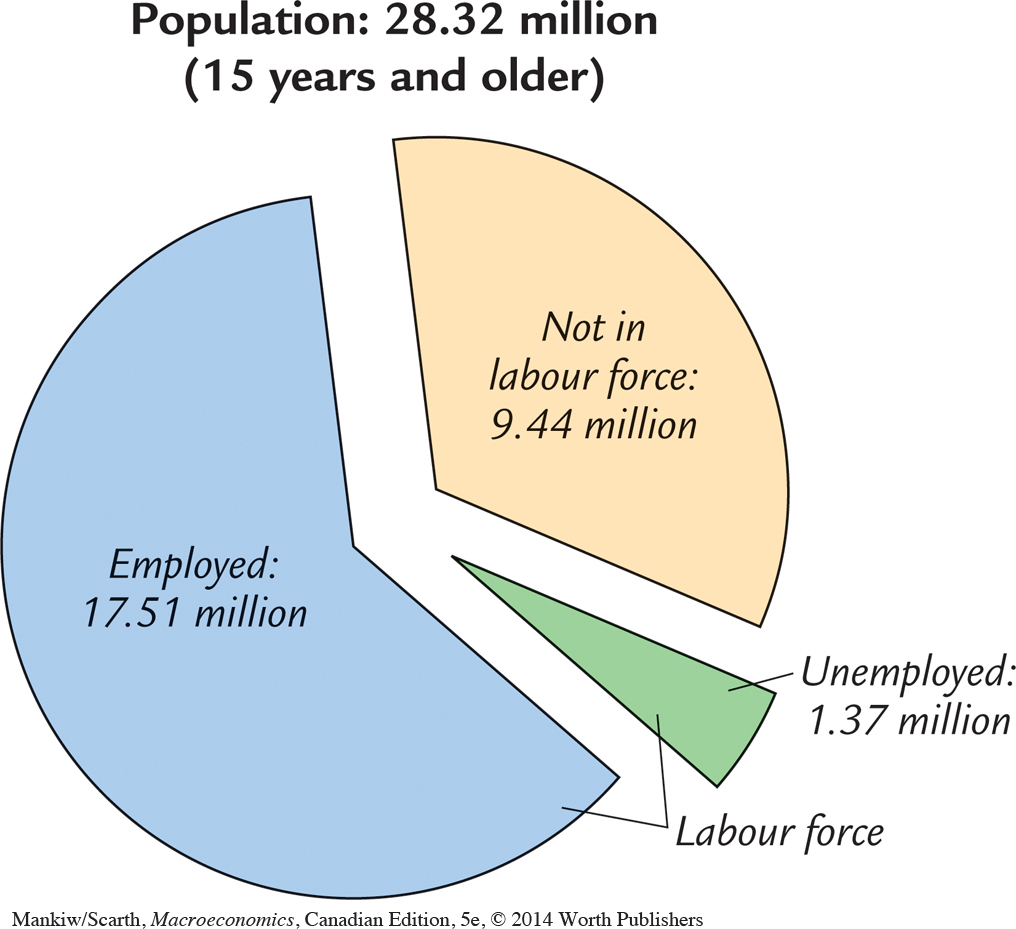
Hence, about two-thirds of the adult population was in the labour force, and 7.3 percent of those in the labour force did not have a job.
CASE STUDY
Trends in Labour-Force Participation
The data on the labour market collected by Statistics Canada reflect not only economic developments, such as the booms and busts of the business cycle, but also a variety of social changes. Longer-term social changes in the roles of men and women in society, for example, are evident in the data on labour-force participation.
41
Just after World War II, men and women had very different economic roles. Only about one third of women were working or looking for work, in contrast to a seven-eights ratio for men. Since then, the difference between the participation rates of men and women has gradually diminished, as growing numbers of women have entered the labour force and some men have left it. Data for 2012 show that 62 percent of women were in the labour force, in contrast to 71 percent of men. As measured by labour-force participation, men and women are now playing a more equal role in the economy.
There are many reasons for this change. In part, it is due to new technologies, such as the washing machine, clothes dryer, refrigerator, freezer, and dishwasher, which have reduced the amount of time required to complete routine household tasks. In part, it is due to improved birth control, which has reduced the number of children born to the typical family. And in part, this change in women’s role is due to changing political and social attitudes. Together these developments have had a profound impact, as demonstrated by these data.
Although the increase in women’s labour-force participation is easily explained, the fall in men’s participation may seem puzzling. There are several developments at work. First, young men now stay in school longer than their fathers and grandfathers did. Second, older men now retire earlier and live longer. Third, with more women employed, more fathers now stay at home to raise their children. Full-time students, retirees, and stay-at-home fathers are all counted as out of the labour force.
Looking ahead, many economists believe that labour-force participation for both men and women may gradually decline over the next several decades. The reason is demographic. People today are living longer and having fewer children today than did their counterparts in previous generations. As a result, the elderly are representing an increasing share of the population. Because the elderly are more often retired and less often members of the labour force, the rising elderly share of the population will tend to reduce the economy’s labour-force participation rate. 
Unemployment, GDP, and Okun’s Law
What relationship should we expect to find between unemployment and real GDP? Because employed workers help to produce goods and services and unemployed workers do not, increases in the unemployment rate should be associated with decreases in real GDP. This negative relationship between cyclical unemployment and GDP is called Okun’s law, after Arthur Okun, the economist who first studied it.5
42
Figure 2-5 uses annual data for Canada to illustrate Okun’s law. This figure is a scatterplot—a scatter of points where each point represents one observation (in this case, the data for a particular year). The vertical axis represents the change in the unemployment rate from the previous year, and the horizontal axis represents the percentage change in GDP. This figure shows clearly that year-to-year changes in the unemployment rate are associated with year-to-year changes in real GDP.
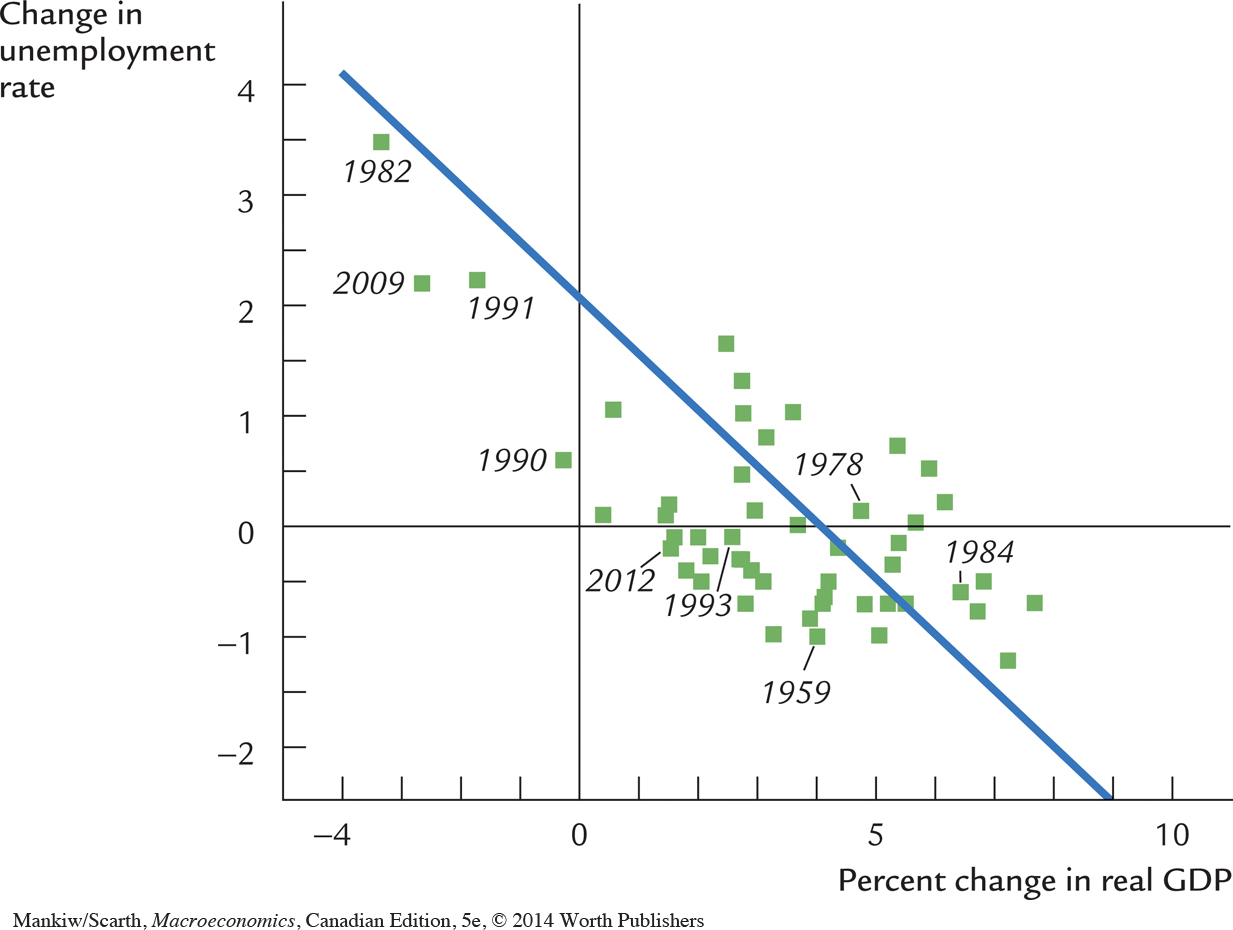
We can be more precise about the magnitude of the Okun’s law relationship. The summary line drawn through the scatter of points tells us that
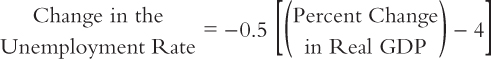
On average, real GDP has grown by about 4 percent each year since 1950; this normal growth is due to population growth, capital accumulation, and technological progress. Okun’s law indicates that this is roughly the amount of growth that is necessary to keep the growth in the number of jobs in pace with the growing size of the labour force—so that the unemployment rate can stay constant. If, however, real GDP growth is only 3 percent, this relationship tells us that the unemployment rate will rise by about one-half of one percentage point.
The implications for unemployment are more dramatic in a recession (when real GDP growth is negative). For example, when real growth is −1 percent, unemployment rises by 0.5 (1 + 4) = 2.5 percentage points. Policymakers often try to stabilize GDP growth around its long-run average value, with a view toward minimizing these disruptive swings in the unemployment rate.