7.3 Population Growth
The basic Solow model shows that capital accumulation, by itself, cannot explain sustained economic growth: high rates of saving lead to high growth temporarily, but the economy eventually approaches a steady state in which capital and output are constant. To explain the sustained economic growth that we observe in most parts of the world, we must expand the Solow model to incorporate the other two sources of economic growth—population growth and technological progress. In this section we add population growth to the model.
Instead of assuming that the population is fixed, as we did in Sections 7-1 and 7-2, we now suppose that the population and the labour force grow at a constant rate n. For example, in Canada during the last 80 years, the population grew about 1.6 percent per year, so n = 0.016. This means that if 16 million people are working one year, then 16.26 million (1.016 × 16) are working the next year, and 16.5 million (1.016 × 16.26) the year after that, and so on.
The Steady State with Population Growth
How does population growth affect the steady state? To answer this question, we must discuss how population growth, along with investment and depreciation, influences the accumulation of capital per worker. As we noted before, investment raises the capital stock, and depreciation reduces it. But now there is a third force acting to change the amount of capital per worker: the growth in the number of workers causes capital per worker to fall.
We continue to let lowercase letters stand for quantities per worker. Thus, k = K/L is capital per worker, and y = Y/L is output per worker. Keep in mind, however, that the number of workers is growing over time.
The change in the capital stock per worker is
Δk = i − (δ + n)k.
This equation shows how new investment, depreciation, and population growth influence the per-worker capital stock. New investment increases k, whereas depreciation and population growth decrease k. We have seen this equation earlier in this chapter for the special case of a constant population (n = 0).
238
We can think of the term (δ + n)k as defining break-even investment—the amount of investment necessary to keep the capital stock per worker constant. Break-even investment includes the depreciation of existing capital, which equals δk. It also includes the amount of investment necessary to provide new workers with capital. The amount of investment necessary for this purpose is nk, because there are n new workers for each existing worker, and because k is the amount of capital for each worker. The equation shows that population growth reduces the accumulation of capital per worker much the way depreciation does. Depreciation reduces k by wearing out the capital stock, whereas population growth reduces k by spreading the capital stock more thinly among a larger population of workers.5
Our analysis with population growth now proceeds much as it did previously. First, we substitute sf(k) for i. The equation can then be written as
Δk = sf(k) −(δ + n)k.
To see what determines the steady-state level of capital per worker, we use Figure 7-11, which extends the analysis of Figure 7-4 to include the effects of population growth. An economy is in a steady state if capital per worker k is unchanging. As before, we designate the steady-state value of k as k*. If k is less than k*, investment is greater than break-even investment, so k rises. If k is greater than k*, investment is less than break-even investment, so k falls.
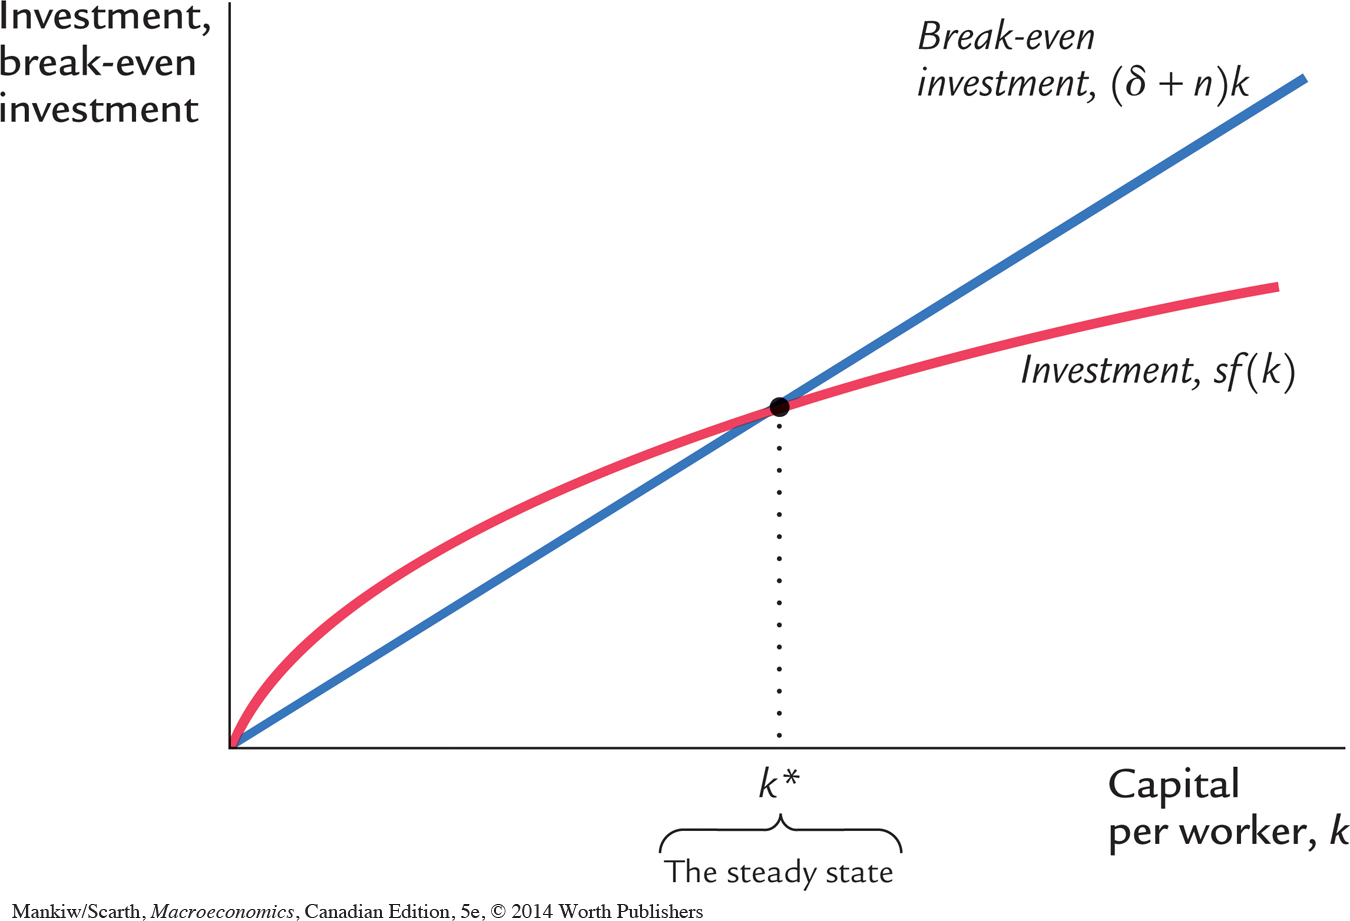
239
In the steady state, the positive effect of investment on the capital stock per worker just balances the negative effects of depreciation and population growth. That is, at k*, Δk = 0 and i* = δk* + nk*. Once the economy is in the steady state, investment has two purposes. Some of it (δsk*) replaces the depreciated capital, and the rest (nk*) provides the new workers with the steady-state amount of capital.
The Effects of Population Growth
Population growth alters the basic Solow model in three ways. First, it brings us closer to explaining sustained economic growth. In the steady state with population growth, capital per worker and output per worker are constant. Because the number of workers is growing at rate n, however, total capital and total output must also be growing at rate n. Hence, while population growth cannot explain sustained growth in the standard of living (because output per worker is constant in the steady state), it can help explain sustained growth in total output.
Second, population growth gives us another explanation for why some countries are rich and others are poor. Consider the effects of an increase in population growth. Figure 7-12 shows that an increase in the rate of population growth from n1 to n2 reduces the steady-state level of capital per worker from k1* to k2*. Because k* is lower, and because y* = f(k*), the level of output per worker y* is also lower. Thus, the Solow model predicts that countries with higher population growth will have lower levels of GDP per person. Notice that a change in the population growth rate, like a change in the saving rate, has a level effect on income per person, but it does not affect the steady-state growth rate of income per person.
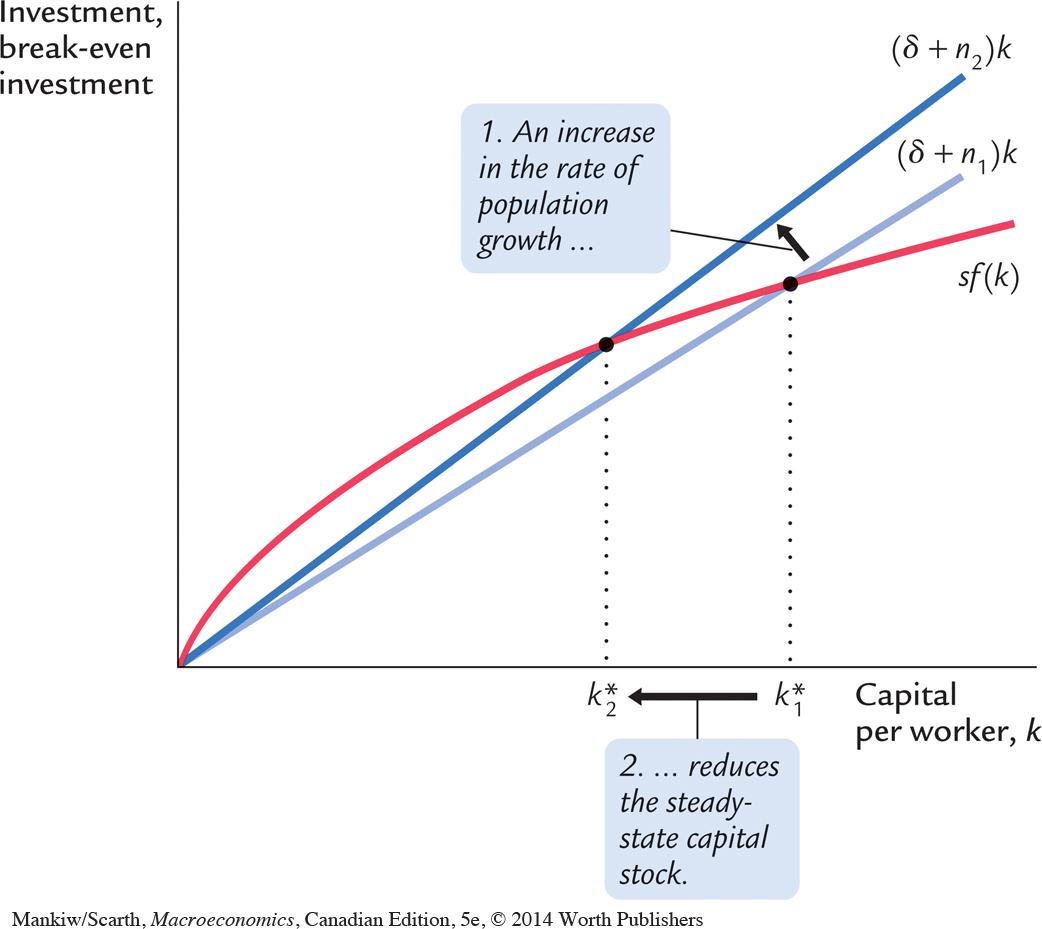
240
Finally, population growth affects our criterion for determining the Golden Rule (consumption-maximizing) level of capital. To see how this criterion changes, note that consumption per worker is
c = y − i.
Because steady-state output is f(k*) and steady-state investment is (δ+ n)k*, we can express steady-state consumption as
c* = f(k*) − (δ + n)k*.
Using an argument largely the same as before, we conclude that the level of k* that maximizes consumption is the one at which
MPK = δ + n,
or equivalently,
MPK − δ = n.
In the Golden Rule steady state, the marginal product of capital net of depreciation equals the rate of population growth.
CASE STUDY
Population Growth Around the World
Let’s return now to the question of why standards of living vary so much around the world. The analysis we have just completed suggests that population growth may be one of the answers. According to the Solow model, a nation with a high rate of population growth will have a low steady-state capital stock per worker and thus also a low level of income per worker. In other words, high population growth tends to impoverish a country because it is hard to maintain a high level of capital per worker when the number of workers is growing quickly. To see whether the evidence supports this conclusion, we again look at cross-country data.
Figure 7-13 is a scatterplot of data for the same countries examined in the previous case study (and in Figure 7-6). The figure shows that countries with high rates of population growth tend to have low levels of income per person. The international evidence is consistent with our model’s prediction that the rate of population growth is one determinant of a country’s standard of living.
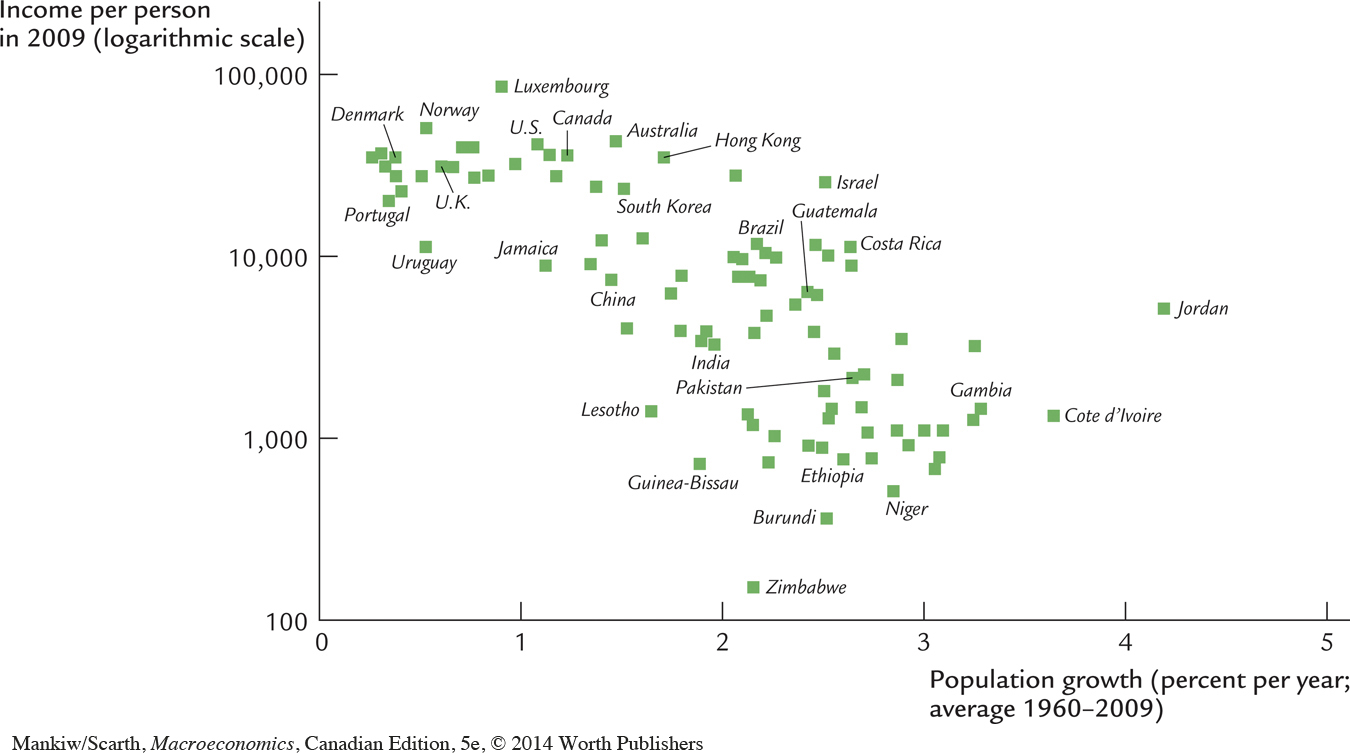
241
This conclusion is not lost on policymakers. Those trying to pull the world’s poorest nations out of poverty, such as the advisers sent to developing nations by the World Bank, often advocate reducing fertility by increasing education about birth-control methods and expanding women’s job opportunities. Toward the same end, China has followed the totalitarian policy of allowing only one child per couple. These policies to reduce population growth should, if the Solow model is right, raise income per person in the long run.
In interpreting the cross-country data, however, it is important to keep in mind that correlation does not imply causation. The data show that low population growth is typically associated with high levels of income per person, and the Solow model offers one possible explanation for this fact, but other explanations are also possible. It is conceivable that high income encourages low population growth, perhaps because birth-control techniques are more readily available in richer countries. The international data can help us evaluate a theory of growth, such as the Solow model, because they show us whether the theory’s predictions are borne out in the world. But often more than one theory can explain the same facts. 
242
CASE STUDY
The Aging of Canada
Over the first 35 years of the present century, the ratio of the Canadian labour force to the Canadian population is expected to fall from 0.525 to 0.475—a 10-percent reduction. As a result, a higher proportion of Canadians will be dependent on a smaller group of workers. The main reason for this development is that the large baby-boom generation is growing older. We can use the Solow growth model to get some idea about how much stress this demographic change will cause for Canadians.
Let β and LS stand for the proportion of the population that is working and the living standard of the average citizen, respectively. Since we have used c to denote consumption per worker, then

If the level of c is independent of β, this equation implies that
ΔLS/LS = Δβ/β.
That is, the living standard of the average person falls by the same percentage as does the proportion of the population that is working.6 We have already learned that the steady-state values of consumption and capital, c* and k*, are determined by the following equations (which do not involve β):
sf(k*) = (δ + n)k*
c* = f(k*) − (δ + n)k*
As a result, according to the Solow model, the steady-state value of c is independent of β.
As noted, Canada’s β will fall by 10 percent over the next 30 years. According to the Solow growth model, this development will lower the average living standard to a level that is 10 percent below what it would otherwise have reached. It turns out that the estimated drop in living standards is smaller when the Solow model is extended to allow for forward-looking behaviour in the savings function (that is, when the model is enriched by including the theory of consumption and saving that we discuss in Chapter 17). This is because forward-looking households save more in anticipation of the coming labour shortage, and the resulting increase in wealth gives households the means to sustain higher levels of consumption when the old-age dependency is high. Nevertheless, this calculation, based on the fundamental version of the Solow model, can make sense of why many Canadians are becoming increasingly concerned about the aging population that is part of the postwar baby boom generation getting older.
Alternative Perspectives on Population Growth
243
The Solow growth model highlights the interaction between population growth and capital accumulation. In this model, high population growth reduces output per worker because rapid growth in the number of workers forces the capital stock to be spread more thinly; so in the steady state each worker is equipped with less capital. The model omits some other potential effects of population growth. Here we consider two—one emphasizing the interaction of population with natural resources, the other emphasizing the interaction of population with technology.
The Malthusian Model In his book An Essay on the Principle of Population as It Affects the Future Improvement of Society, the early economist Thomas Robert Malthus (1766–1834) offered what may be history’s most chilling forecast. Malthus argued that an ever increasing population would continually strain society’s ability to provide for itself. Humankind, he predicted, would forever live in poverty.
Malthus began by noting that “food is necessary to the existence of man” and that “the passion between the sexes is necessary and will remain nearly in its present state.” He concluded that “the power of population is infinitely greater than the power in the earth to produce subsistence for man.” According to Malthus, the only check on population growth was “misery and vice.” Attempts by charities or governments to alleviate poverty are counterproductive, he argued, because they merely allow the poor to have more children, placing even greater strains on society’s productive capabilities.
Although the Malthusian model may have described the world when Malthus lived, its prediction that humankind would remain in poverty forever has proven very wrong. The world population has increased about sixfold over the past two centuries, but average living standards are much higher. Because of economic growth, chronic hunger and malnutrition are less common now than they were in Malthus’s day. Famines occur from time to time, but they are more often the result of unequal income distribution or political instability than the inadequate production of food.
Malthus failed to see that the growth in humankind’s ingenuity would more than offset the effects of a larger population. Pesticides, fertilizers, mechanized farm equipment, new crop varieties, and other technological advances that Malthus never imagined have allowed each farmer to feed ever greater numbers of people. Even with more mouths to feed, fewer farmers are necessary because each farm is so productive. Today, fewer than 2 percent of North Americans work on farms, producing enough food to feed the nation and some excess to export as well.
In addition, although the “passion between the sexes” is just as strong now as it was in Malthus’s day, the link between passion and population growth that Malthus assumed has been broken by modern birth control. Many advanced nations, such as those in Western Europe, are now experiencing fertility below replacement rates. Over the next century, shrinking populations may be more likely than rapidly expanding ones. There is now little reason to think that an ever expanding population will overwhelm food production and doom mankind to poverty.7
244
There has been a revival of Malthus-like reasoning in recent decades. In the present version, the concern is not that higher population will pull living standards back down to subsistence levels. Instead, it is the running out of nonrenewable resources that is cited as something that will lead to the same outcome, as well as to a vastly altered planet, with global warming and destroyed ecosystems. As in Malthus’ time, the pessimists in the current debate put little faith in the self-correcting mechanisms of the market system. Both optimists and pessimists are aware that the increased scarcity of key raw materials and the increased concern for the environment will create profit opportunities for firms to address these concerns. Optimists expect that technological progress will rescue humankind from our sustainability concerns, just as it did when the agricultural revolution answered Malthus’s worries. Further, optimists stress that economic growth gives society the ability to meet these challenges. Pessimists are not nearly so sure; they see the environmental costs of economic growth as much bigger than the benefits. Unfortunately, further discussion of this central issue is beyond the scope of this book.
The Kremerian Model While Malthus saw population growth as a threat to rising living standards, economist Michael Kremer has suggested that world population growth is a key driver of advancing economic prosperity. If there are more people, Kremer argues, then there are more scientists, inventors, and engineers to contribute to innovation and technological progress.
As evidence for this hypothesis, Kremer begins by noting that, over the broad span of human history, world growth rates have increased together with world population. For example, world growth was more rapid when the world population was 1 billion (which occurred around the year 1800) than it was when the population was only 100 million (around 500 B.C.). This fact is consistent with the hypothesis that having more people induces more technological progress.
Kremer’s second, more compelling piece of evidence comes from comparing regions of the world. The melting of the polar ice caps at the end of the ice age around 10,000 B.C. flooded the land bridges and separated the world into several distinct regions that could not communicate with one another for thousands of years. If technological progress is more rapid when there are more people to discover things, then the more populous regions should have experienced more rapid growth.
And indeed they did. The most successful region of the world in 1500 (when Columbus reestablished technological contact) included the Old World civilizations of the large Eurasia-Africa region. Next in technological development were the Aztec and Mayan civilizations in the Americas, followed by the hunter-gatherers of Australia, and then the primitive people of Tasmania, who lacked even fire making and most stone and bone tools.
245
The least populous isolated region was Flinders Island, a tiny island between Tasmania and Australia. With few people to contribute new innovations, Flinders Island had the least technological advance and in fact seemed to regress. Around 3000 B.C., human society on Flinders Island died out completely.
Kremer concludes from this evidence that a large population is a prerequisite for technological advance.8