9.4 Stabilization Policy
Fluctuations in the economy as a whole come from changes in aggregate supply or aggregate demand. Economists call exogenous changes in these curves shocks to the economy. A shock that shifts the aggregate demand curve is called a demand shock, and a shock that shifts the aggregate supply curve is called a supply shock. These shocks disrupt economic well-being by pushing output and employment away from their natural levels. One goal of the model of aggregate supply and aggregate demand is to show how shocks cause economic fluctuations.
Another goal of the model is to evaluate how macroeconomic policy can respond to these shocks. Economists use the term stabilization policy to refer to policy actions aimed at reducing the severity of short-run economic fluctuations. Because output and employment fluctuate around their long-run natural levels, stabilization policy dampens the business cycle by keeping output and employment as close to their natural levels as possible.
In the coming chapters, we examine in detail how stabilization policy works and what practical problems arise in its use. Here we begin our analysis of stabilization policy by examining how monetary policy might respond to shocks. Monetary policy is an important component of stabilization policy because, as we have seen, the money supply has a powerful impact on aggregate demand.
Shocks to Aggregate Demand
309
Consider an example of a demand shock: the introduction and expanded availability of credit cards. Because credit cards are often a more convenient way to make purchases than using cash, they reduce the quantity of money that people choose to hold. This reduction in money demand is equivalent to an increase in the velocity of money. When each person holds less money, the money demand parameter k falls. This means that each dollar of money moves from hand to hand more quickly, so velocity V ( = 1/k) rises.
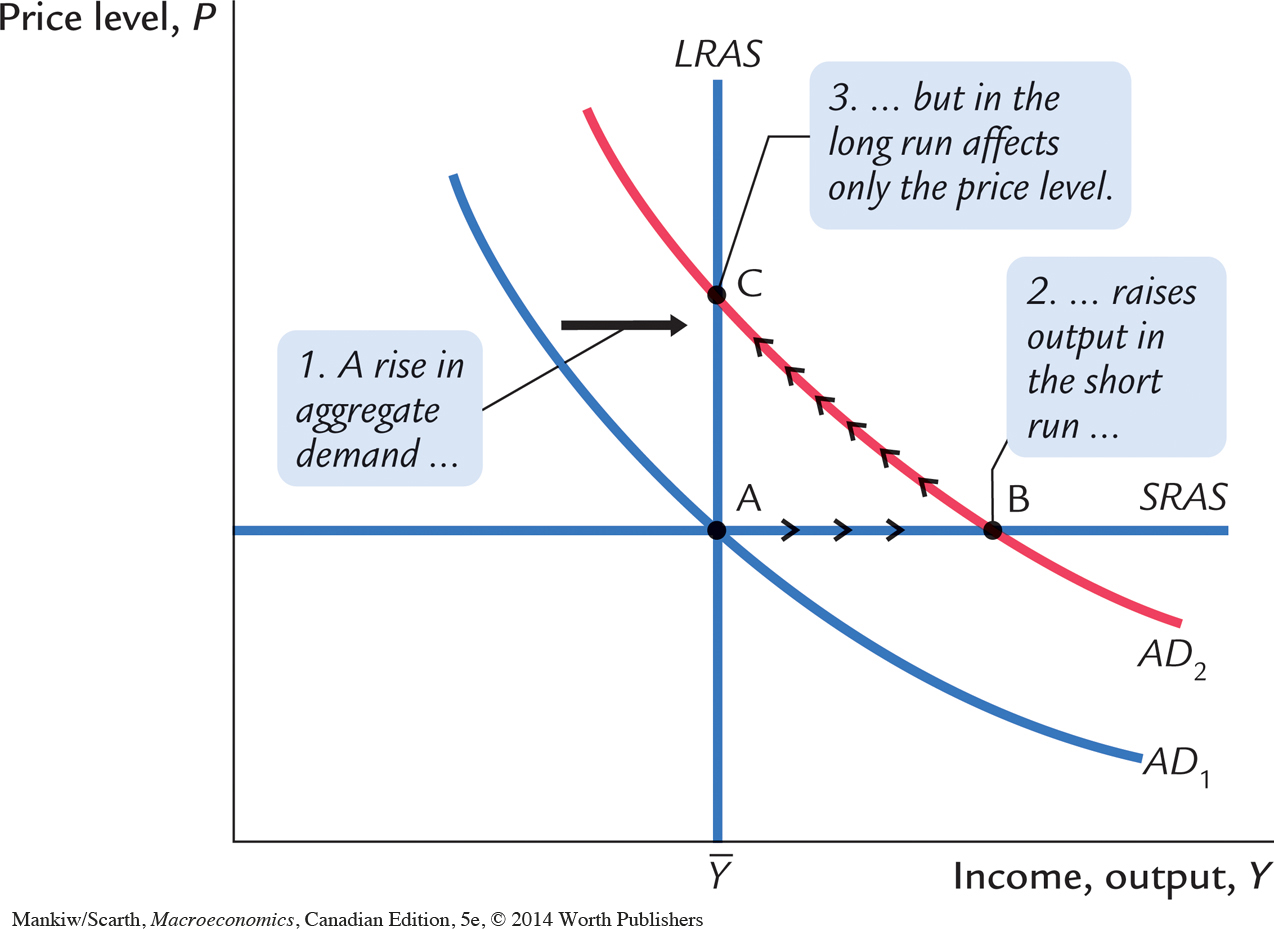
If the money supply is held constant, the increase in velocity causes nominal spending to rise and the aggregate demand curve to shift outward, as in Figure 9-11. In the short run, the increase in demand raises the output of the economy—it causes an economic boom. At the old prices, firms now sell more output. Therefore, they hire more workers, ask their existing workers to work longer hours, and make greater use of their factories and equipment.
310
Over time, the high level of aggregate demand pulls up wages and prices. As the price level rises, the quantity of output demanded declines, and the economy gradually approaches the natural rate of production. But during the transition to the higher price level, the economy’s output is higher than the natural rate.
What can the the Bank of Canada do to dampen this boom and keep output closer to the natural level? The Bank of Canada might reduce the money supply to offset the increase in velocity. Offsetting the change in velocity would stabilize aggregate demand. Thus, the Bank of Canada can reduce or even eliminate the impact of demand shocks on output and employment if it can skillfully control the money supply. Whether the Bank of Canada in fact has the necessary skill is a more difficult question, which we take up in Chapters 14 and 15.
Shocks to Aggregate Supply
Shocks to aggregate supply can also cause economic fluctuations. A supply shock is a shock to the economy that alters the cost of producing goods and services and, as a result, the prices that firms charge. Because supply shocks have a direct impact on the price level, they are sometimes called price shocks. Here are some examples:
A drought that destroys crops. The reduction in food supply pushes up food prices.
A new environmental protection law that requires firms to reduce their emissions of pollutants. Firms pass on the added costs to customers in the form of higher prices.
An increase in union aggressiveness. This pushes up wages and the prices of the goods produced by union workers.
The organization of an international oil cartel. By curtailing competition, the major oil producers can raise the world price of oil.
All these events are adverse supply shocks, which means they push costs and prices upward. A favourable supply shock, such as the breakup of an international oil cartel, reduces costs and prices.
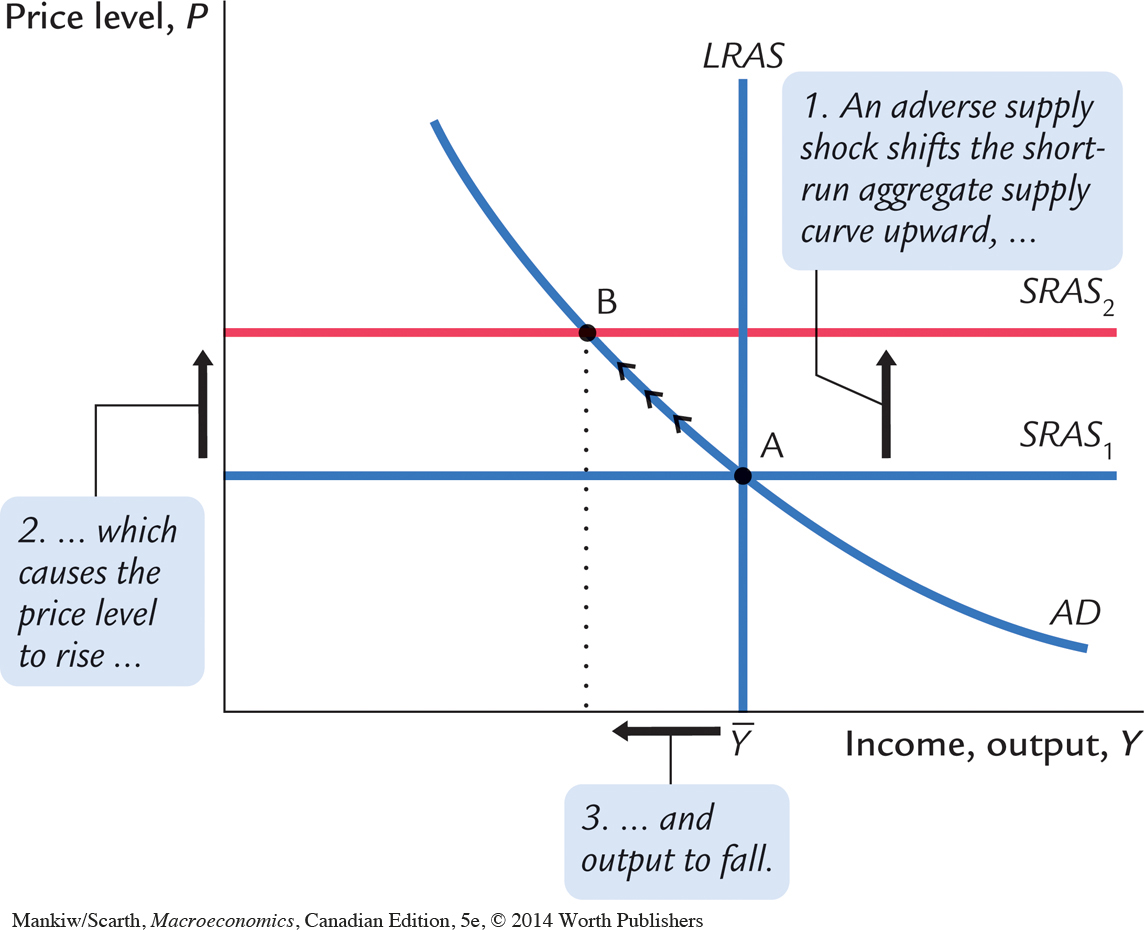
Figure 9-12 shows how an adverse supply shock affects the economy. The short-run aggregate supply curve shifts upward. (The supply shock may also lower the natural level of output and thus shift the long-run aggregate supply curve to the left, but we ignore that effect here.) If aggregate demand is held constant, the economy moves from point A to point B: the price level rises and the amount of output falls below the natural level. An experience like this is called stagflation, because it combines stagnation (falling output) with inflation (rising prices).
Faced with an adverse supply shock, a policymaker with the ability to influence aggregate demand, such as the Bank of Canada, has a difficult choice between two options. The first option, implicit in Figure 9-12, is to hold aggregate demand constant. In this case, output and employment are lower than the natural level. Eventually, prices will fall to restore full employment at the old price level (point A). But the cost of this process is a painful recession.
311
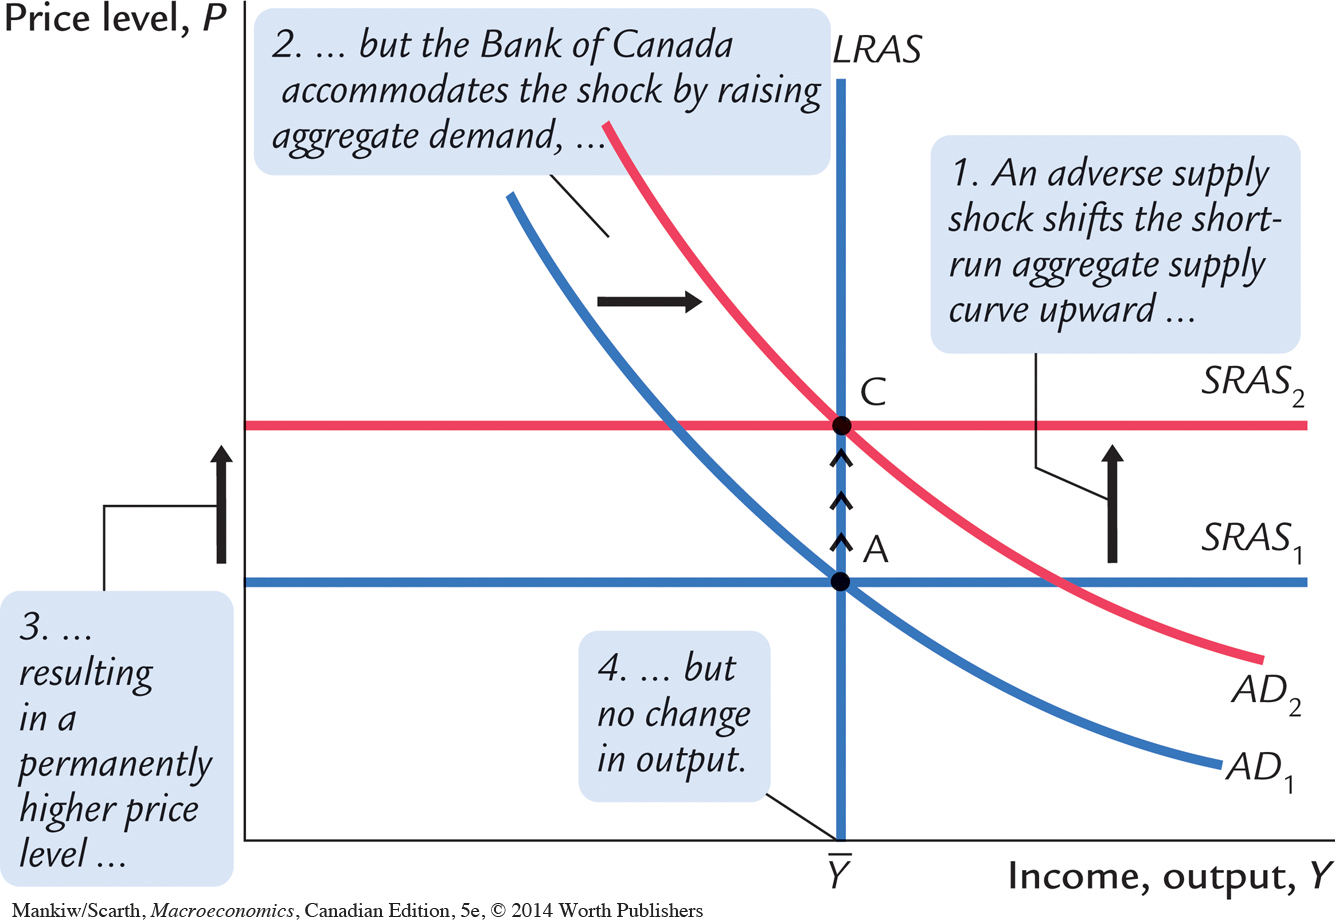
The second option, illustrated in Figure 9-13, is to expand aggregate demand to bring the economy toward the natural level more quickly. If the increase in aggregate demand coincides with the shock to aggregate supply, the economy goes immediately from point A to point C. In this case, the Bank of Canada is said to accommodate the supply shock. The drawback of this option, of course, is that the price level is permanently higher. There is no way to adjust aggregate demand both to maintain full employment and to keep the price level stable.
312
CASE STUDY
How OPEC Helped Cause Stagflation in the 1970s
The most disruptive supply shocks in recent history are due to changes in world primary commodity prices. The first of these was due to the formation of OPEC, the Organization of Petroleum Exporting Countries. In the early 1970s, OPEC’s coordinated reduction in the supply of oil nearly doubled the world price. This increase in oil prices caused stagflation in most industrial countries. For example, in the United States, inflation rose from 6.2 percent to 11 percent between 1973 and 1974, while the unemployment rate almost doubled, from 4.9 percent in 1973 to 8.5 percent in 1975.
The unemployment effects of the OPEC oil-price increase were less dramatic in Canada for two reasons. First, using expansionary aggregate demand policies, the federal government cushioned the recession that would have followed from the large drop in export sales to the United States. Second, the government imposed a price control that precluded domestic oil prices from increasing as much as world prices. This price limit irritated many in western Canada whose incomes were tied to the oil industry. In any event, the federal government’s policy kept Canada’s aggregate supply curve from shifting upward as much as it otherwise would have. Canada’s inflation rate only went up by 3.3 percentage points in 1974 (compared to 4.8 percentage points in the United States), and Canada’s unemployment rate increased by only 1.5 percentage points in the 1973–1975 period (compared to 3.6 percentage points in the United States).
A few years later, when the world economy had nearly recovered from the first OPEC recession, almost the same thing happened again. OPEC raised oil prices, causing further stagflation. The average increase in world oil prices in the 1979–1981 period was almost 40 percent. U.S. inflation rose from 7.7 percent in 1978 to 10.3 percent by 1981, while unemployment rose from 6.1 percent to 7.5 percent over the same period. In Canada, the federal government did not attempt the same insulation of the Canadian economy from this world event, so responses were more dramatic than in the mid-1970s. Inflation rose from 8.9 percent in 1978 to 12.5 percent in 1981, while unemployment rose from 8.3 percent to 11 percent. When less protected from an adverse supply-side shock, Canada suffered a bigger bout of stagflation.3
3 Some economists have suggested that changes in oil prices played a major role in economic fluctuations even before the 1970s. See James D. Hamilton, “Oil and the Macroeconomy Since World War II,” Journal of Political Economy 91 (April 1983): 228–248.
More recently, OPEC has not been such a major cause of economic fluctuations. Conservation efforts and technological changes have made Western economies less susceptible to oil shocks. Our economy today is more service-based and less manufacturing-based, and services typically use less energy to produce than do manufactured goods. Because the amount of oil consumed per unit of real GDP has fallen by more than half since 1980, it takes a much larger oil price change to have the impact on the economy that we observed in the 1970s. And, of course, Canada is increasingly a producer, not just a user, of oil.