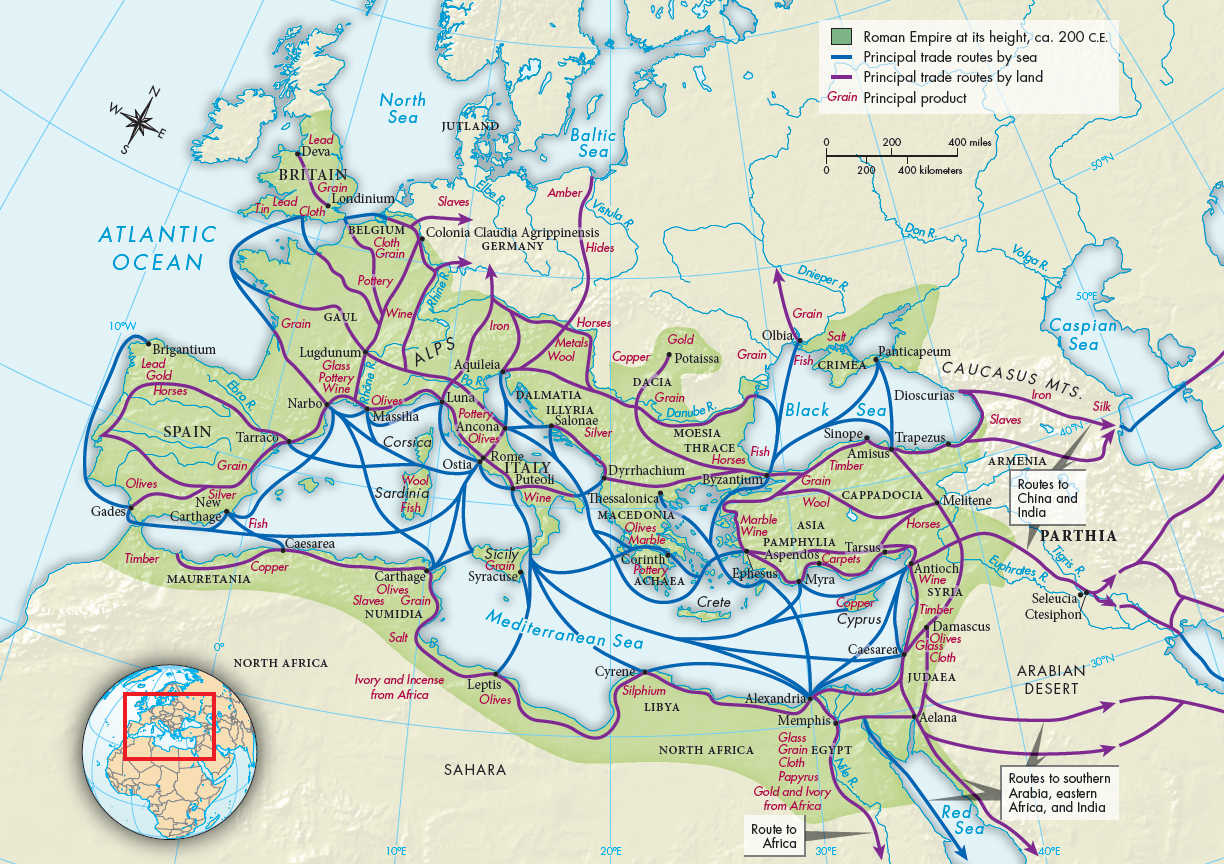
MAP 6.2 Production and Trade in the Pax Romana, ca. 27 B.C.E.–180 C.E.This map gives a good idea of the principal products of various parts of the Roman Empire at its height and the trade routes connecting these regions. Map 10.2 is a similar map that shows products and trade in roughly the same area nearly a millennium later. Examine both maps and answer the following questions.> MAPPING THE PASTANALYZING THE MAP: What similarities and differences do you see in products during these two periods?
CONNECTIONS: To what extent did Roman trade routes influence later European trade routes?
CONNECTIONS: To what extent did Roman trade routes influence later European trade routes?