Mapping the Past for Chapter 26
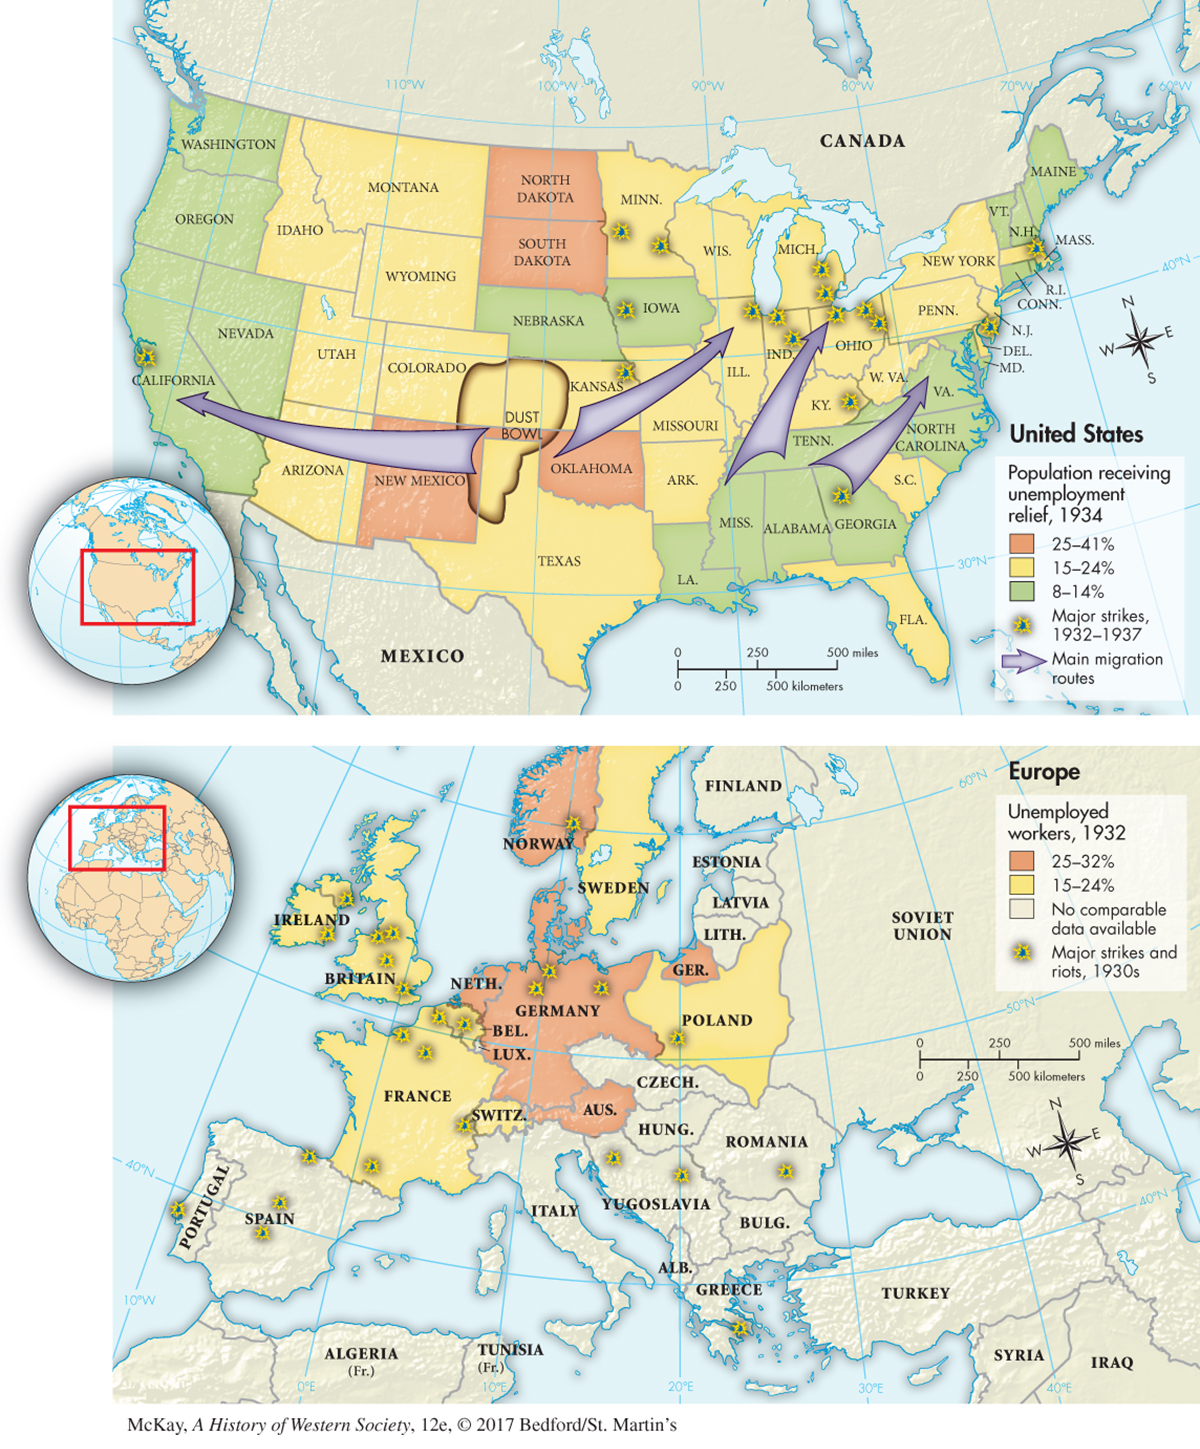
Figure 26.1: MAPPING THE PASTMAP 26.1 The Great Depression in the United States and Europe, 1929–1939 These maps show that unemployment was high almost everywhere, but that national and regional differences were also substantial.ANALYZING THE MAP Which European countries had the highest rate of unemployment? How do the rates of people on unemployment relief in the United States compare to the percentage of unemployed workers in Europe? In the United States, what were the main channels of migration?CONNECTIONS What tactics of reform and recovery did European nations use to combat the deprivations of the Great Depression?