The Economics and Ownership of Television and Cable
It is not much of a stretch to define TV programming as a system that mostly delivers viewers to merchandise displayed in blocks of ads. And with more than $60 billion at stake in advertising revenues each year, networks and cable services work hard to attract the audiences and subscribers that bring in the advertising dollars. But although broadcast and cable advertising declined slightly during the 2008–09 financial crisis, one recent study reported that more than 80 percent of consumers say that TV advertising—of all ad formats—has the most impact or influence on their buying decisions. A distant second, third, and fourth in the study were magazines (50 percent), online (47 percent), and newspapers (44 percent).21 (See Figure 6.5 for costs for a thirty-second commercial during prime-time programs.) To understand the TV economy today, we need to examine the production, distribution, and syndication of programming; the rating systems that set advertising rates; and the ownership structure that controls programming and delivers content to our homes.
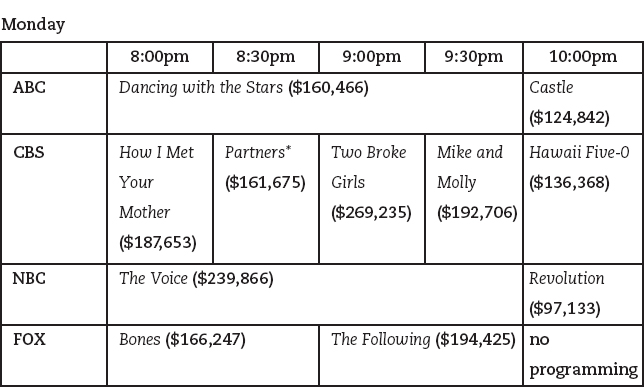
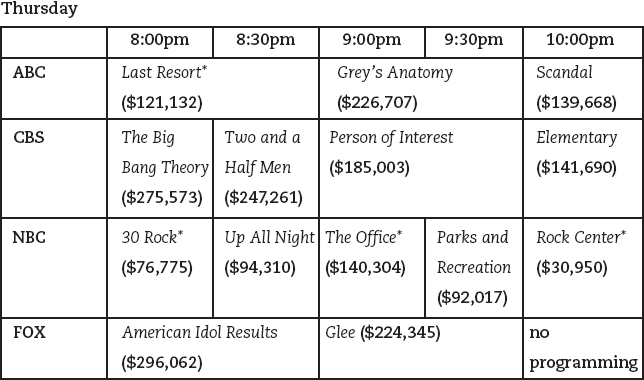
The average costs for a thirty-second commercial during prime-time programs on Monday and Thursday nights in 2012–2013 is shown.
Source: Brian Steinberg, “TV Ad Prices: ‘Idol’ No Match for Football,” AdAge, October 21, 2012, http://adage.com/article/media/TV-ad-prices-idol-match-football/237874/.
Note: * = Canceled shows