Figure 8.2: // PRIME-TIME NETWORK TV PRICING
Figure 8.2: The top-earning television shows in 2014 and 2013 based on the average cost of a thirty-second ad.
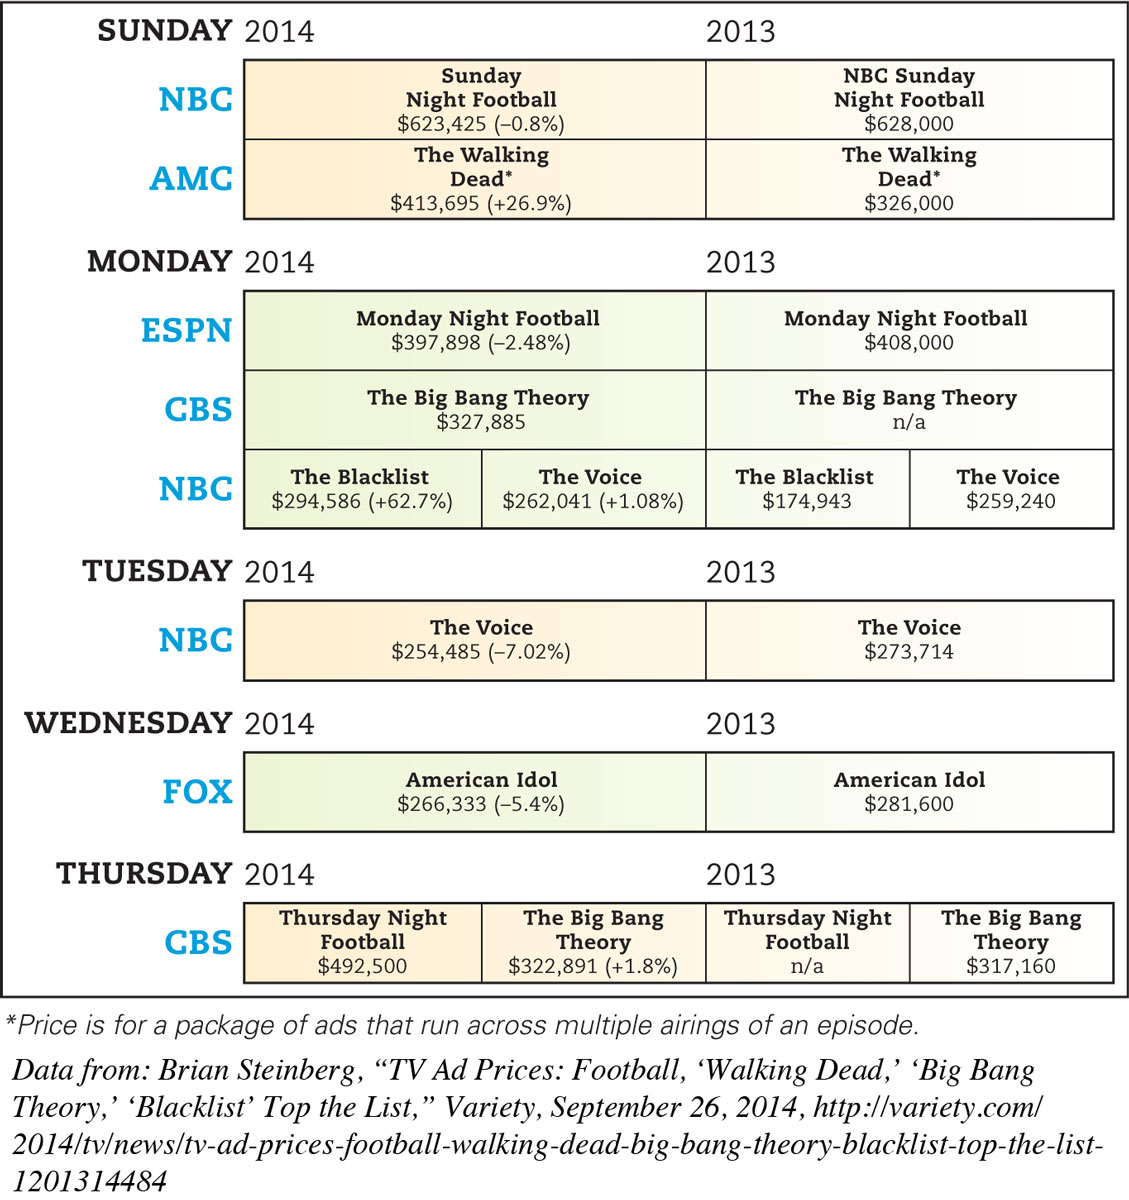
Figure 8.2: *Price is for a package of ads that run across multiple airings of an episode.
Data from: Brian Steinberg, “TV Ad Prices: Football, ‘Walking Dead,’ ‘Big Bang Theory,’ ‘Blacklist’ Top the List,” Variety, September 26, 2014, http://variety.com/2014/tv/news/tv-ad-prices-football-walking-dead-big-bang-theory-blacklist-top-the-list-1201314484