GLOBAL VARIATION IN PER CAPITA ECOLOGICAL FOOTPRINT
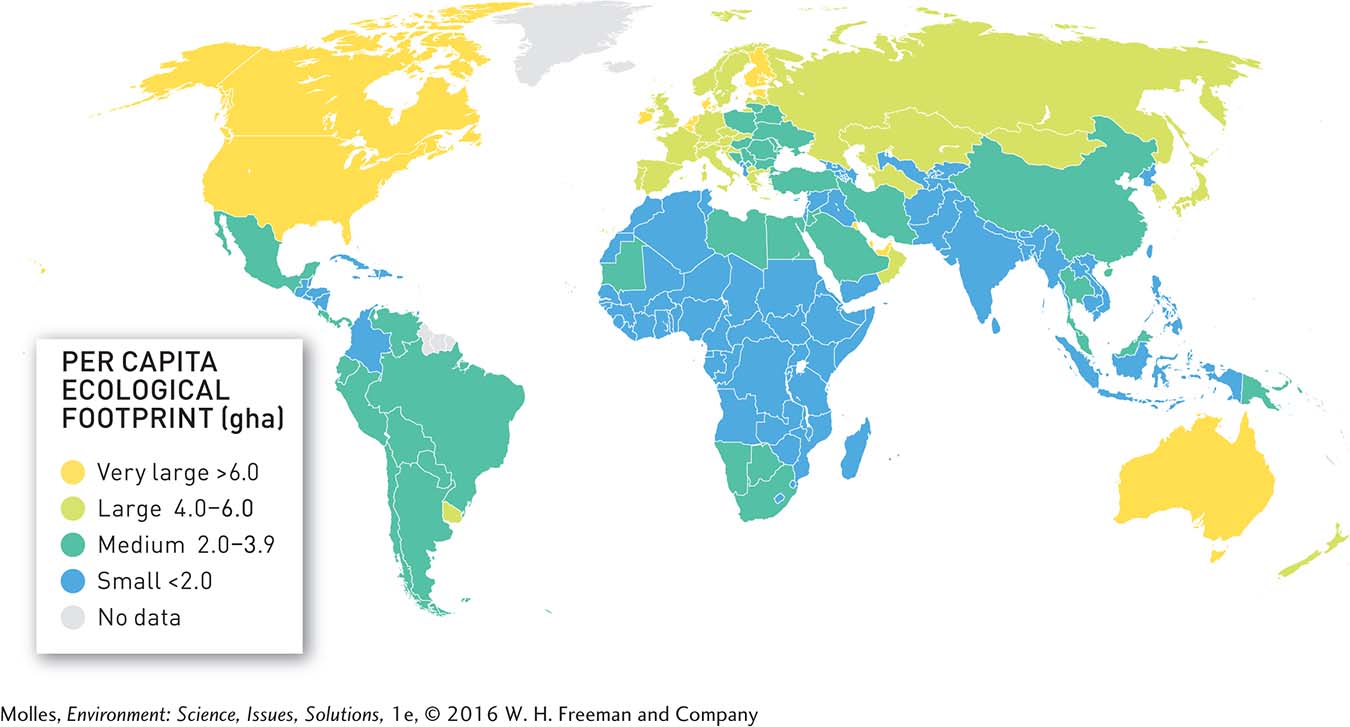
FIGURE 5.13a The largest per capita ecological footprints in global hectares (gha) are concentrated in North America, Europe, northern Asia, Australia, and New Zealand. The lowest per capita ecological footprints occur in Africa, southern Asia, and Latin America. (Data from WWF [World Wildlife Fund], 2006; WWF, 2012)
PER CAPITA ECOLOGICAL FOOTPRINT INCREASES WITH DEVELOPMENT
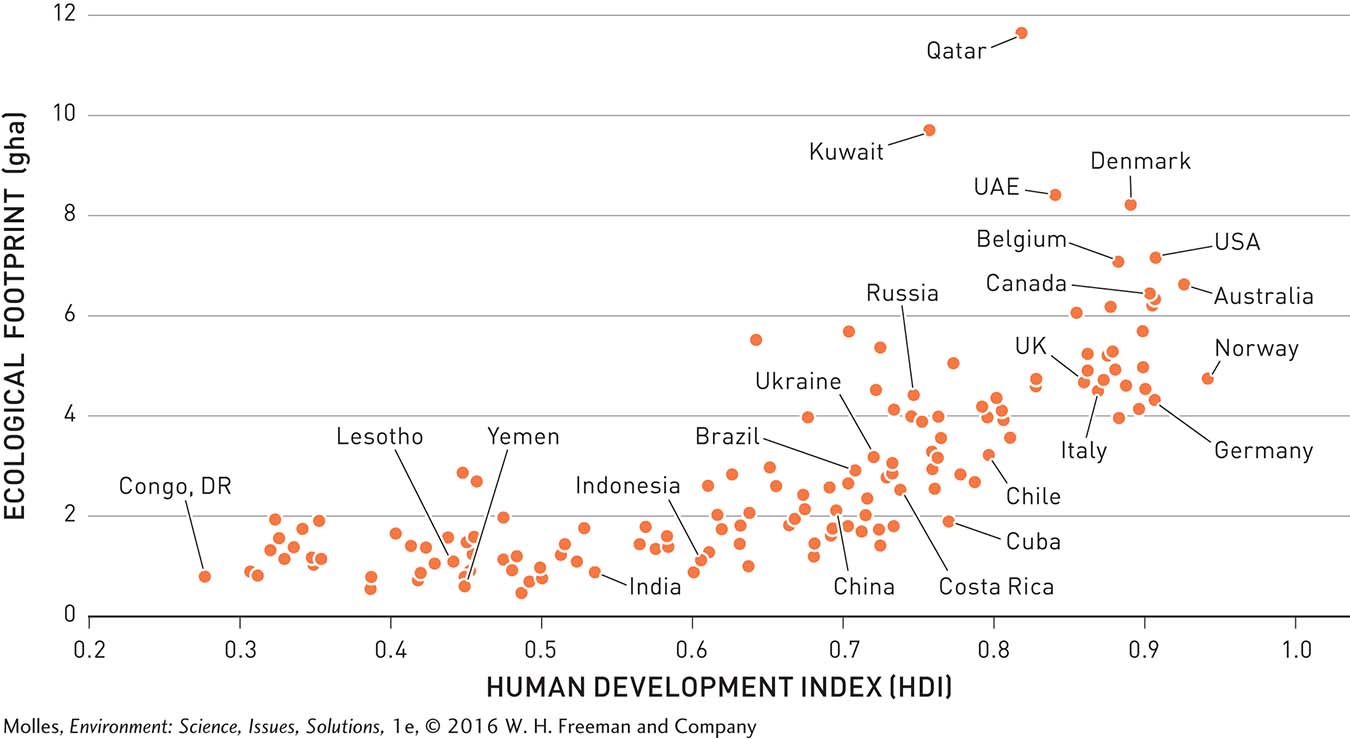
FIGURE 5.13b Human development requires investment in health care, education, and economic infrastructure. Resource consumption increases as a consequence. However, how much resource consumption increases with development varies widely. Many countries have attained high levels of development with much smaller ecological footprints than others. (Data from United Nations Human Development Report, 2011; WWF [World Wildlife Fund], 2012)