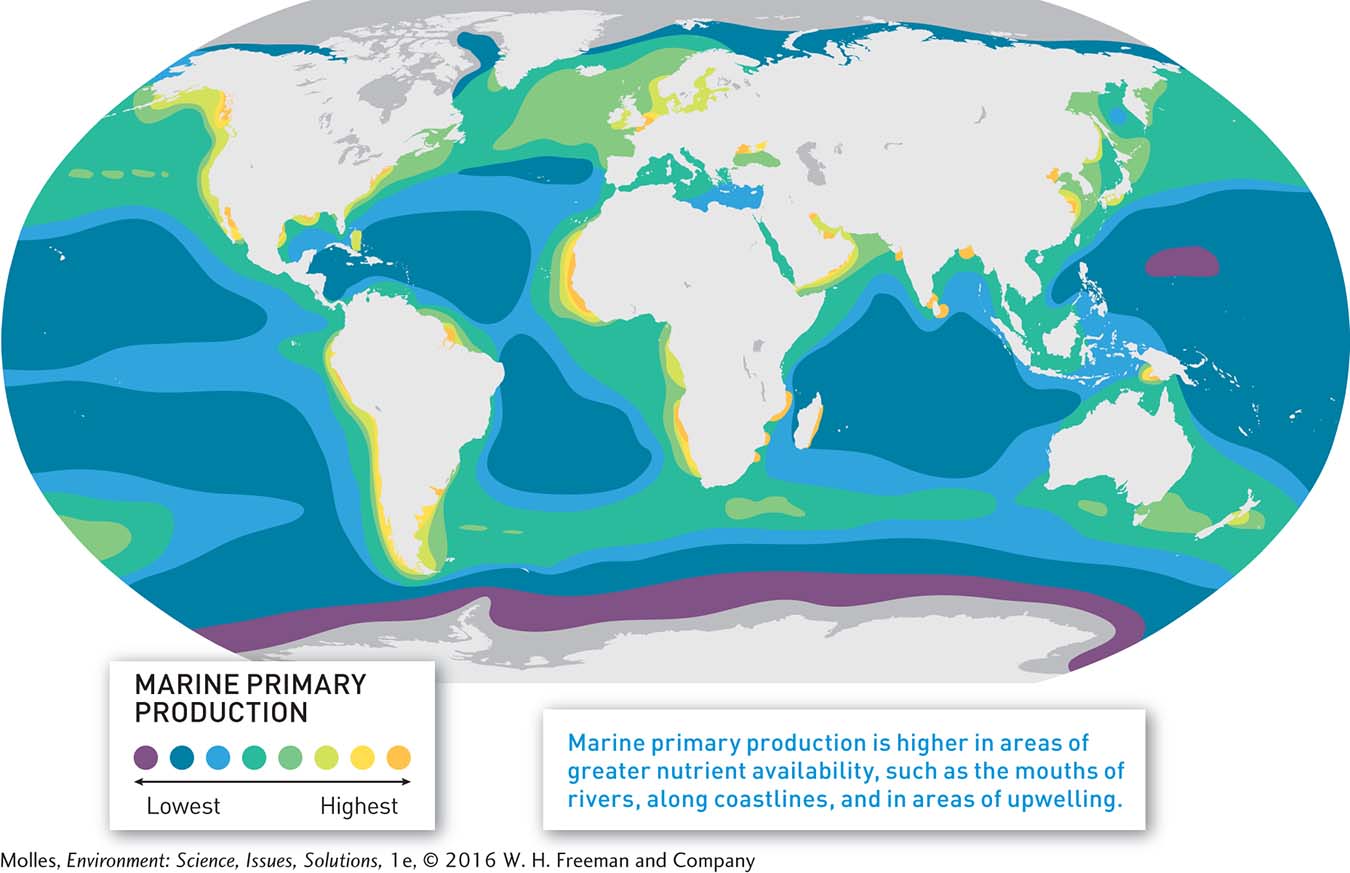
VARIATION IN PRIMARY PRODUCTION ACROSS THE WORLD’S OCEANS
FIGURE 8.7
High levels of primary production are limited to approximately 10% of the world’s oceans. (Data from Ryther, 1969; Field et al., 1998)