INCOME LEVEL AND MUNICIPAL SOLID WASTE COMPOSITION
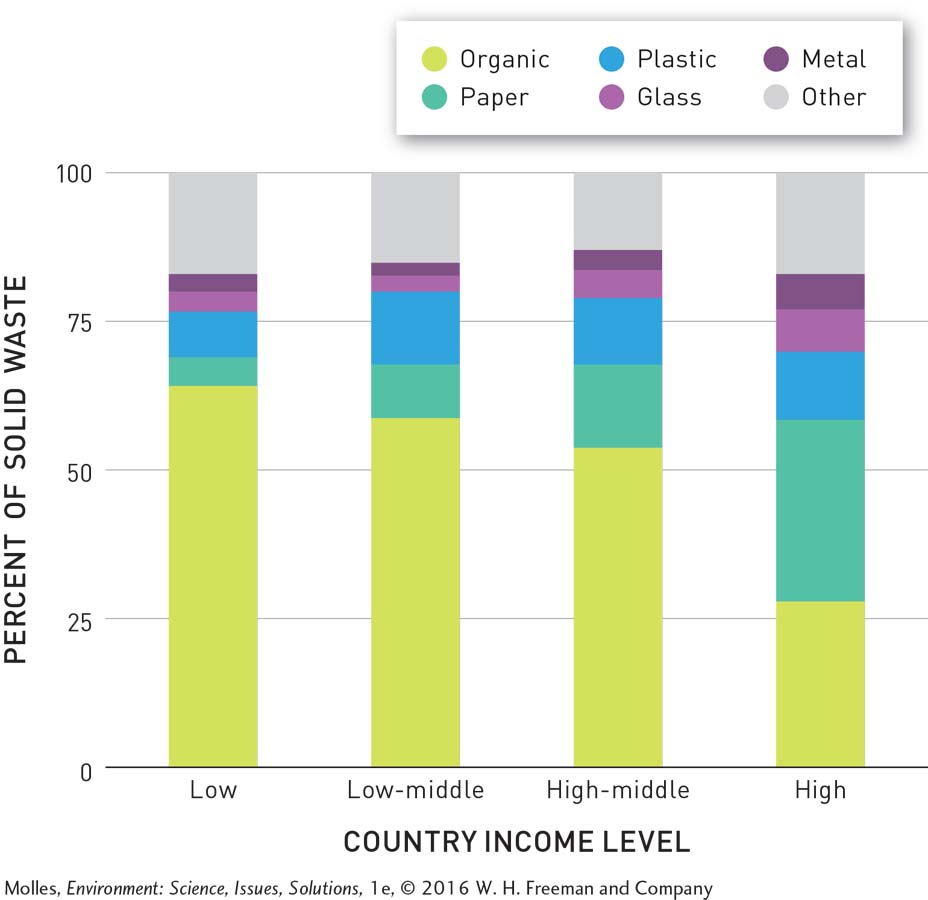
FIGURE 12.5 Relative decreases in organic waste and increases in paper in the waste stream appear to be the main changes in waste composition from low-