41 YEARS OF GENERATING MUNICIPAL SOLID WASTE IN THE UNITED STATES
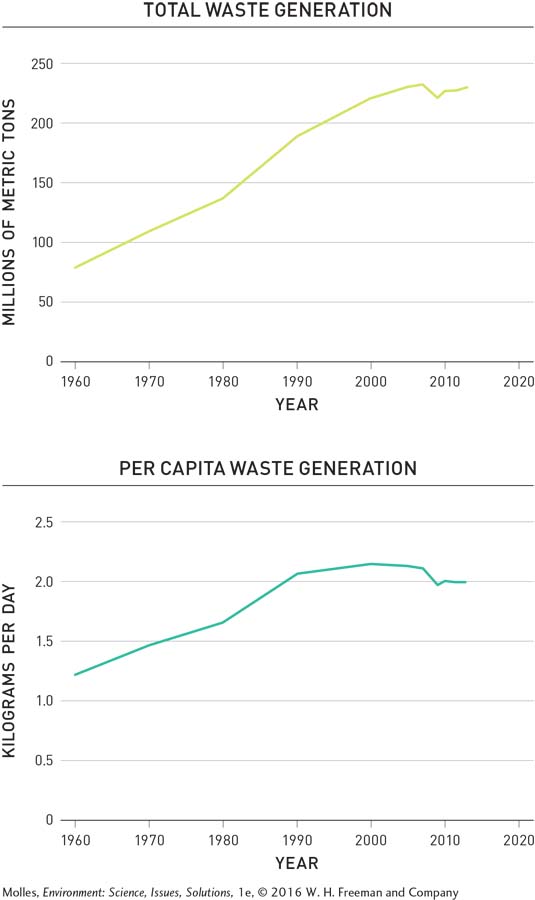
FIGURE 12.9 Total annual waste generation increased from 1960 until 2007, then decreased about 2.5% by 2011 (top). Per capita generation of waste (bottom) peaked in 2000, decreasing a full 7.5% by 2011. (Data from EPA, 2013c)