GLOBAL TEMPERATURES AVERAGED BY DECADE
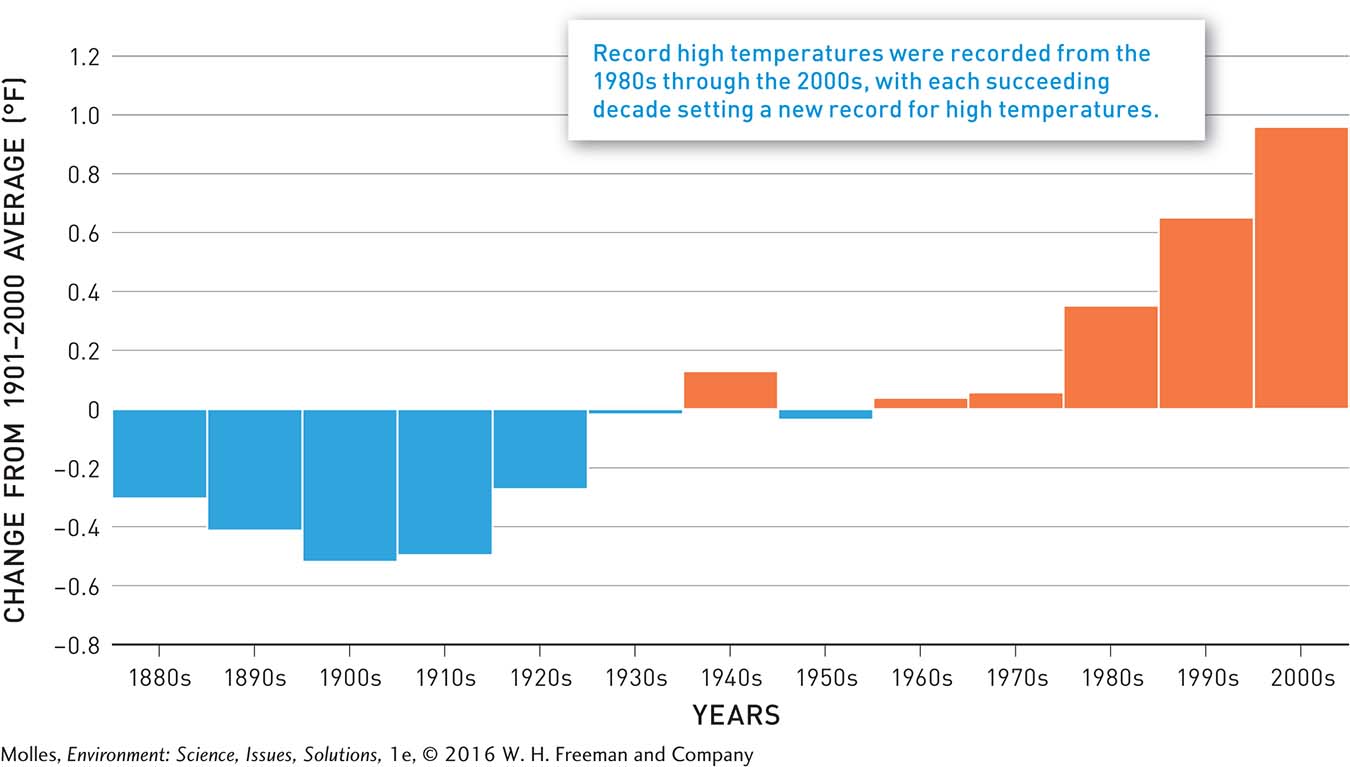
FIGURE 14.20 Plotting global temperature changes since 1880 as decadal averages removes annual fluctuations in the record, revealing clearly the record-