12.9 Recycling and demanufacturing are critical to reducing waste
recycling The process of returning raw materials in waste (e.g., glass, plastics, metal, paper) to the manufacturer for reuse.
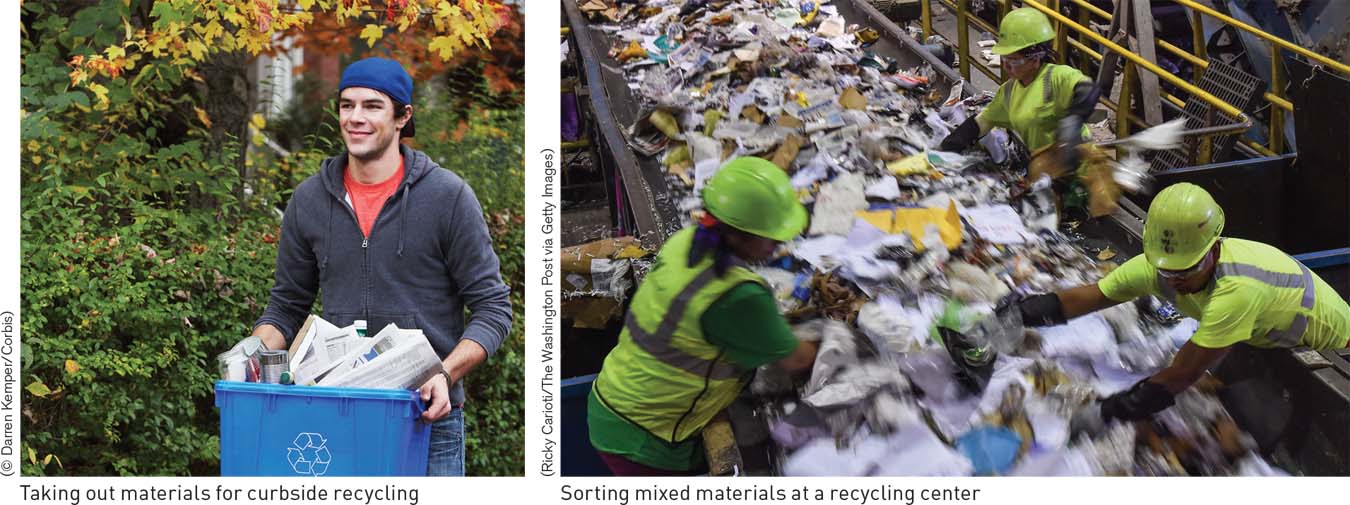
No matter how much we reduce our waste, it’s a fact of life that many consumer products must be purchased with a disposable container. However, these materials can be kept out of the waste stream by promoting recycling, the process of returning the raw materials present in a form of waste back to the manufacturer to be used again. Commonly recycled materials include glass, plastics, metal, paper, and cardboard (Figure 12.20).
Recycling has a number of benefits. When a disposable product, such as an aluminum can, is recycled, both raw material and energy are conserved. Less source material, bauxite ore in this case, must be mined and processed. The amount of energy needed to melt and mold recycled material is much less than when starting with raw ore. Finally, the product is kept out of the waste stream for at least one more round of use.
Financial Incentives for Recycling
One way to increase recycling rates is to require deposits on bottles and cans. The state of Michigan, for example, imposes a 10-
Take Back Laws and Demanufacturing
take back laws State regulations that require manufacturers of various electronics to pay for e-
One recent development is take back laws, which typically require manufacturers of televisions, computers, and other electronics to pay for e-
demanufacturing The dismantling of equipment, especially electronics, into constituent components and scrap metals that can be reused or recycled.
Dismantling electronic equipment into constituent components and scrap metals is called demanufacturing. Although the process can be dangerous when conducted informally, without the oversight of environmental or health regulators, it has the potential to separate hazardous waste from valuable materials that can be recycled. Several electronics recycling centers have emerged in urban centers, supporting the view that demanufacturing could be a vital source of jobs and income.
377
Progress in Municipal Waste Management
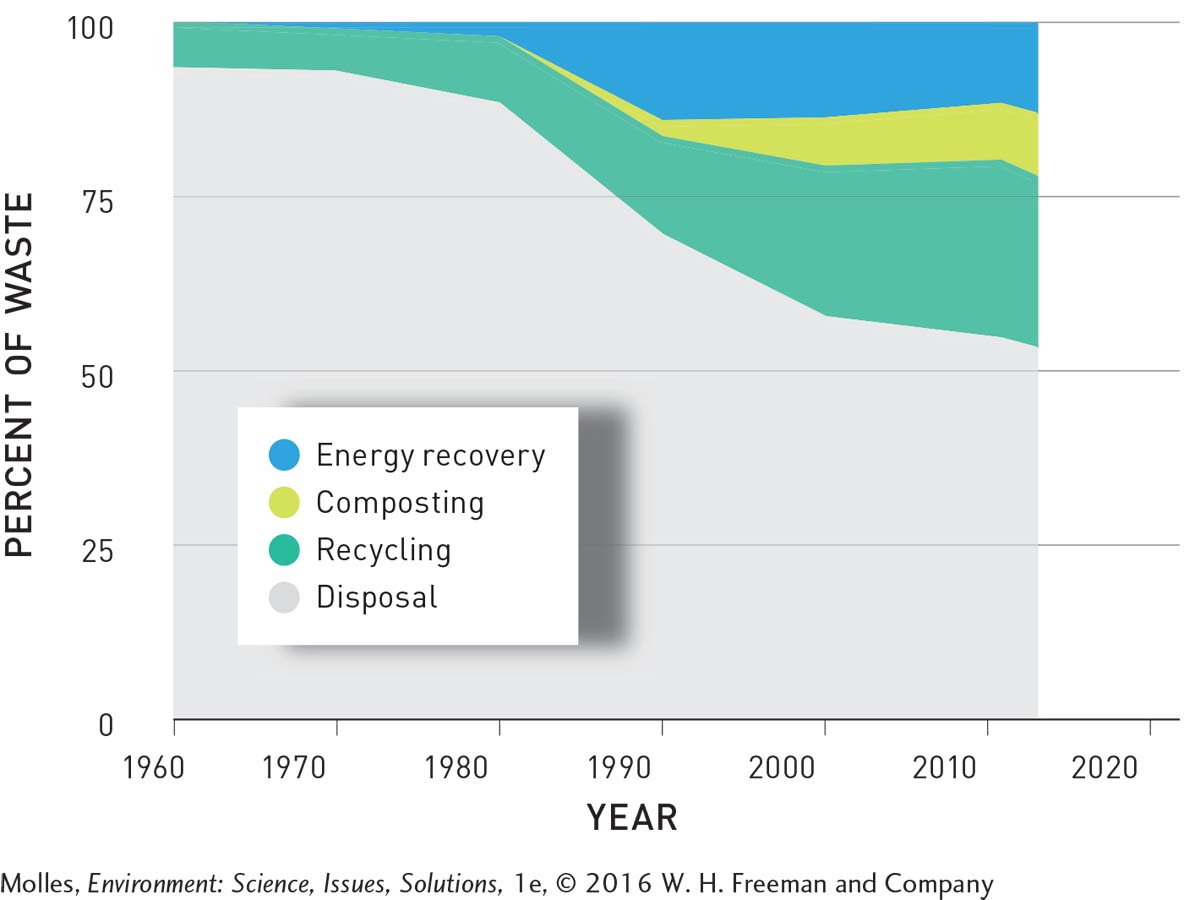
The problem of waste disposal in Philadelphia, now managed in a more integrated fashion, is much less pressing than during the time of the Khian Sea. City ordinances were passed to support a goal of a 50% recycling rate. Although this goal has not yet been reached, recycling rates have steadily improved, as they have across the United States. From 1960 to 2013, the amount of MSW recycling increased from just 6% to 25%. Over this same period, the amount of waste composted increased to 9% and the amount burned for energy recovery rose to 13%. As a consequence, the amount of MSW ending up in landfills across the country fell from 94% to 53% between 1960 and 2013 (Figure 12.21).
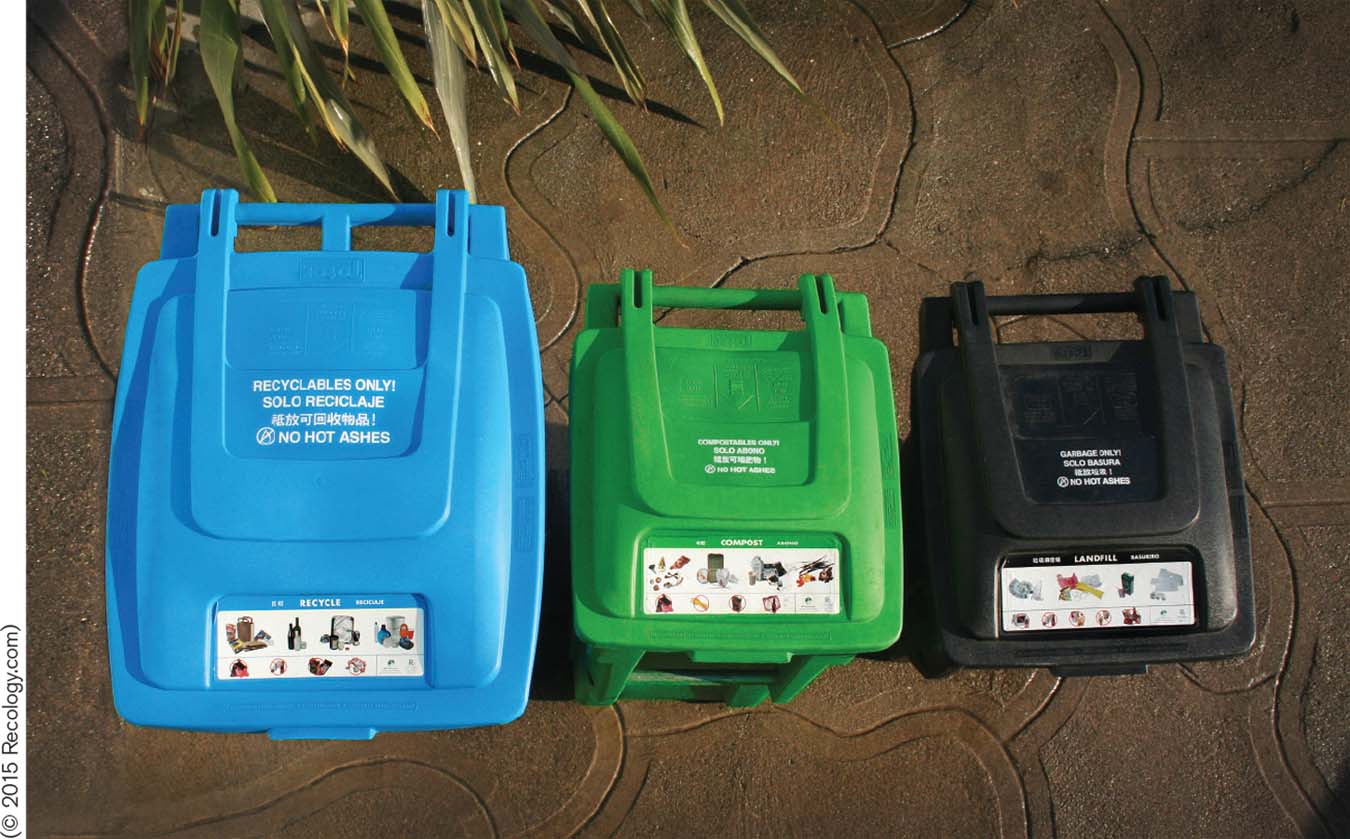
While the progress made in reducing disposal rates across the United States is encouraging, some cities are doing better than others. For example, San Francisco has succeeded in reducing the amount of solid waste ending up in landfills to just 20% of the total generated. The city has achieved this low level of waste disposal by emphasizing the key elements of integrated waste management: reducing and reusing, recycling, and composting. To facilitate these management goals, residents have access to three refuse bins, one for recyclable materials, one for compostable materials (e.g., food and garden wastes), and one for solid waste destined for the landfill (Figure 12.22).

How can the recovery of valuable resources from e-
Based on San Francisco’s waste handling system and other measures, an independent study has ranked it as the “greenest city” in North America. However, the city’s ultimate goal is zero waste. While no municipality has yet attained this goal, Europe’s greenest city, Copenhagen, Denmark, with a disposal rate of only 2% of the waste generated, comes close. Like San Francisco, Copenhagen stresses waste reduction and reuse, recycling, and composting. In addition, any waste that cannot be recycled or composted is burned to generate energy in electrical power plants.
Incineration and Energy Recovery
fly ash Particles formed during combustion that are light enough to become airborne and exit a combustion chamber with exhaust gases, including soot and dust.
bottom ash The ash that accumulates at the bottom of an incinerator during the combustion of solid waste.
After removing everything that can be recycled or composted, the remaining trash can be burned to reduce the waste volume by up to 90%. Less waste volume means less landfill space is needed. However, incineration is economically viable only where space for landfills is highly restricted. Incineration facilities are expensive to build and pollution control systems are essential for reducing hazardous emissions. One potential source of environmental impact is the ash produced by incinerators. There are two forms of ash produced by incinerators. Fly ash is made of lighter, noncombustible material that is normally sent airborne during incineration. Bottom ash is the heavier, noncombustible material left over after incineration. Fly ash has a high concentration of toxins, and incinerators are required to have filters and electrostatic precipitators, similar to those in coal-
378
Once recyclable metals have been recovered from incinerator ash, the residual is sent to a disposal site. The EPA requires regular testing of ash from incinerator waste for the presence of hazardous waste. When the presence of hazardous substances exceeds certain thresholds, the ash must be treated as hazardous waste and disposed of in specially designed hazardous waste disposal sites. Otherwise, in the United States, ash in these plants is disposed in sanitary landfills designed to accept standard MSW. Several European countries use nonhazardous incinerator ash for highway building and other construction.
What opportunities are there for turning “wastes” into valuable resources?
While properly built and managed incinerators are costly, they can be used to recapture some of the chemical energy that remains in MSW by including a steam-
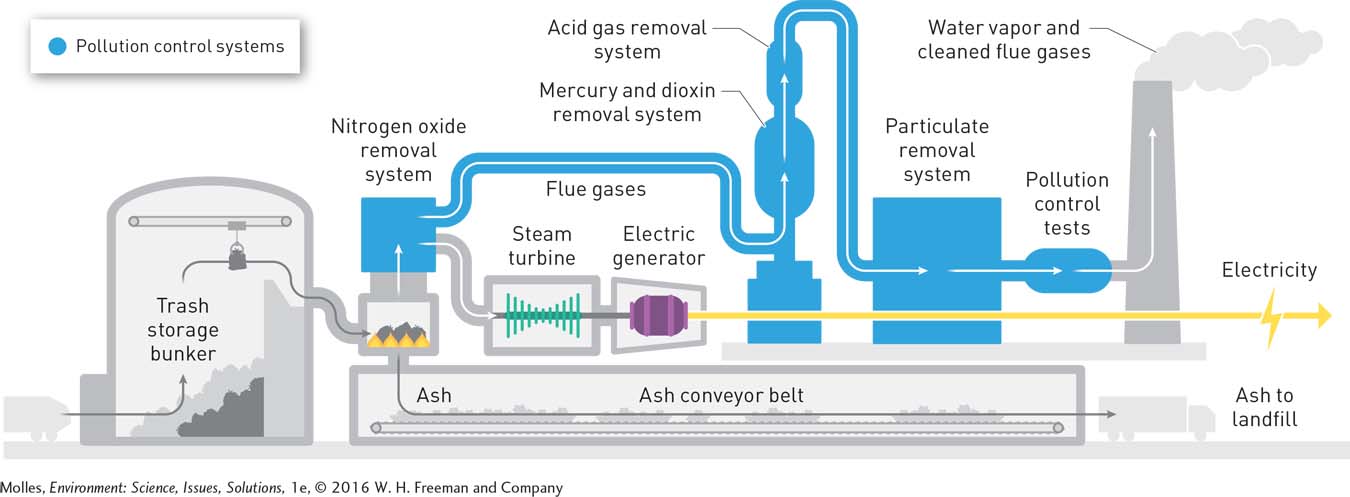
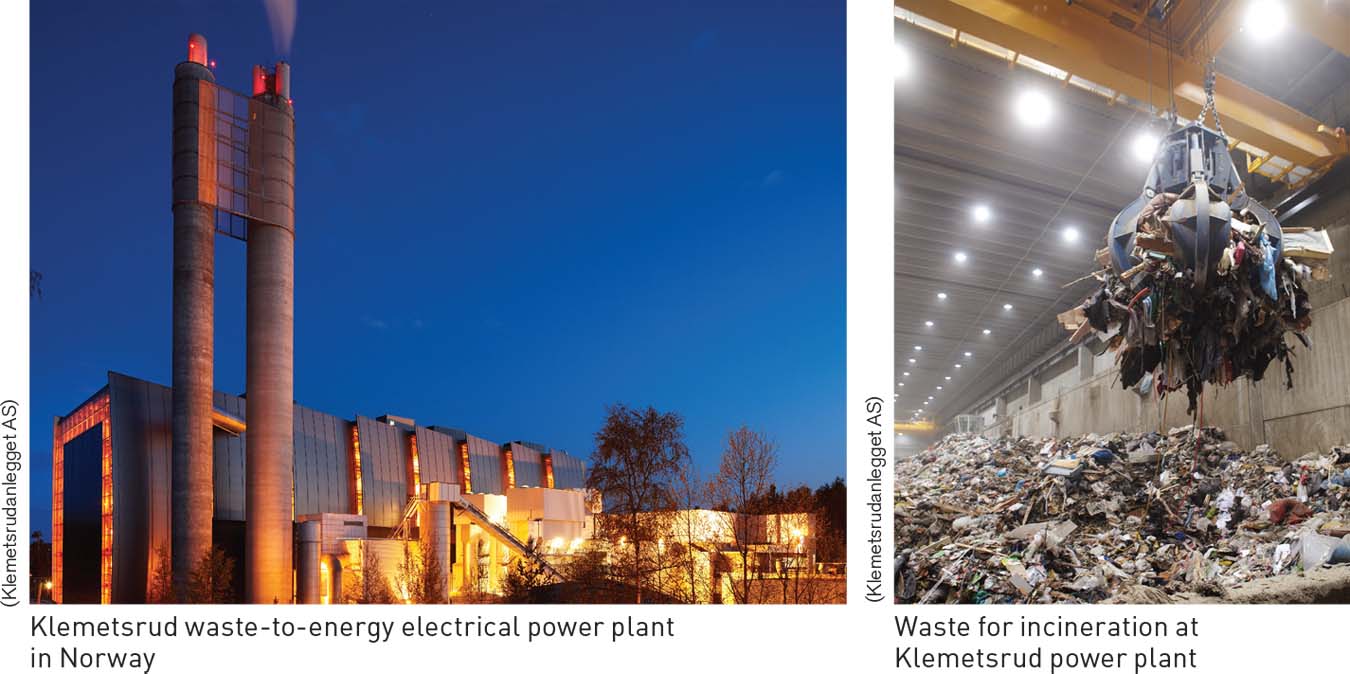
These power plants must have the latest pollution control systems to avoid releasing hazardous wastes into the air. Similar plants are in operation in Europe. For example, two waste-
Think About It
San Francisco’s drive toward a zero waste future is accompanied by strict ordinances that require the sorting of waste into recyclable, compostable, and other fractions by residents. Penalties for not doing so include stiff fines. Could the achievements in waste reduction in the city have been attained without such laws and penalties? Explain.
Compare and contrast the typical human system of waste management with an ecological cycle. Why is the human system considered unsustainable?
What contributes to the fact that incinerating waste to generate electricity is a more common part of waste management in Europe than in North America?