12.2 Waste has diverse sources and properties and varies with level of economic development
waste stream The flow of discarded materials, especially municipal solid waste, from institutions, homes, and businesses.
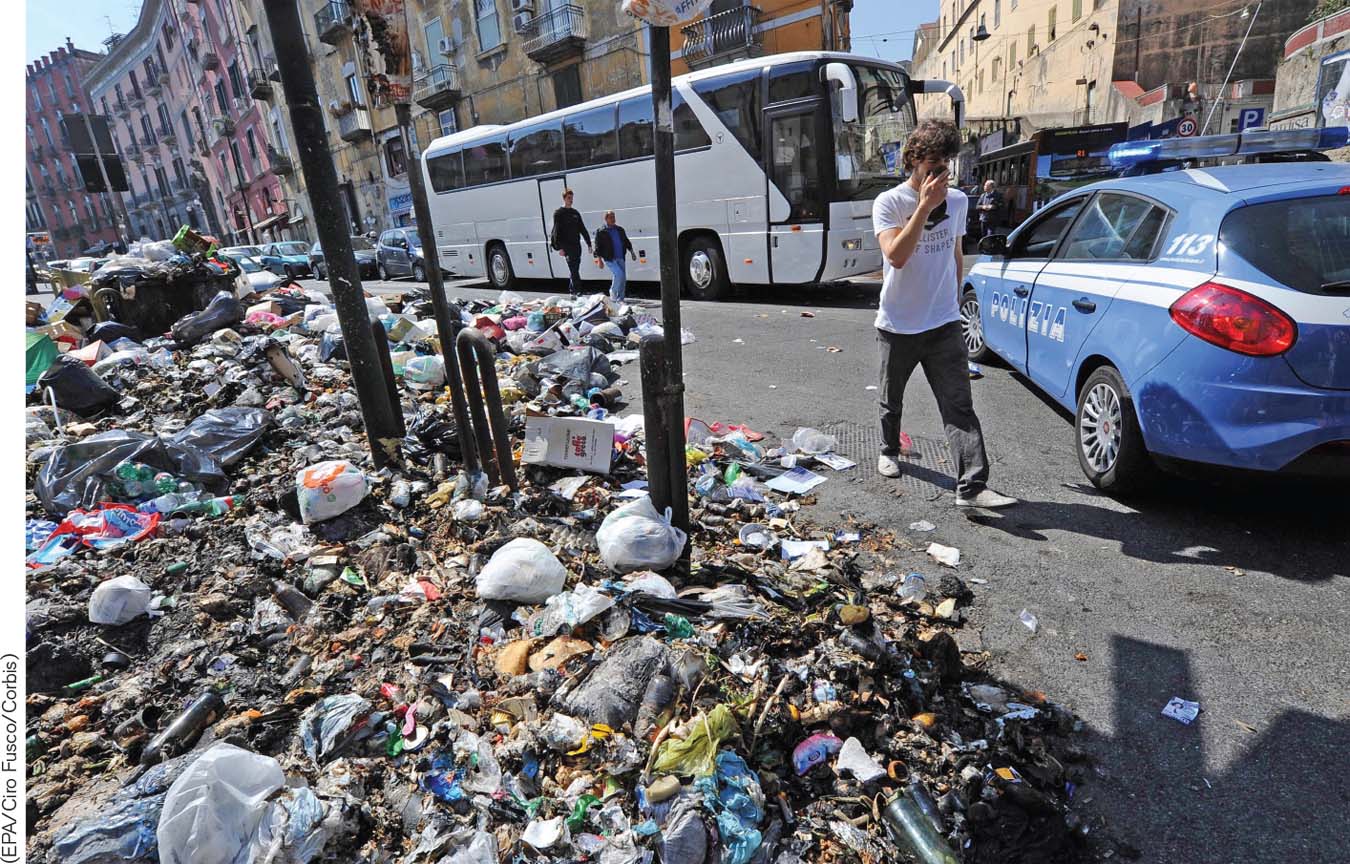
Archeologists can infer a great deal about past societies by studying waste dumps, such as the Emeryville Shellmound. In the modern world, waste comes from many sources and is made up of countless forms of discarded material. This mixture is called the waste stream. What would some future archeologist conclude about our contemporary world from studying our waste stream? Two conclusions would be inescapable: Rich countries produce a lot more waste than poor countries, and the types of things they each throw out differs greatly.
Municipal Solid Waste
municipal solid waste (MSW) Solid waste from institutions, households, and businesses, including paper, packaging, food scraps, glass, metal, textiles and other solid discards.
While people everywhere generate solid waste, the amount of waste generated is particularly large in cities because urban populations are particularly concentrated. Municipal solid waste (MSW) includes all solid waste from institutions, households, and businesses, including paper, packaging, food scraps, glass, metal, textiles, and all other solid discards. Consequently, waste management is one of the most critical services that cities provide. In low-
362
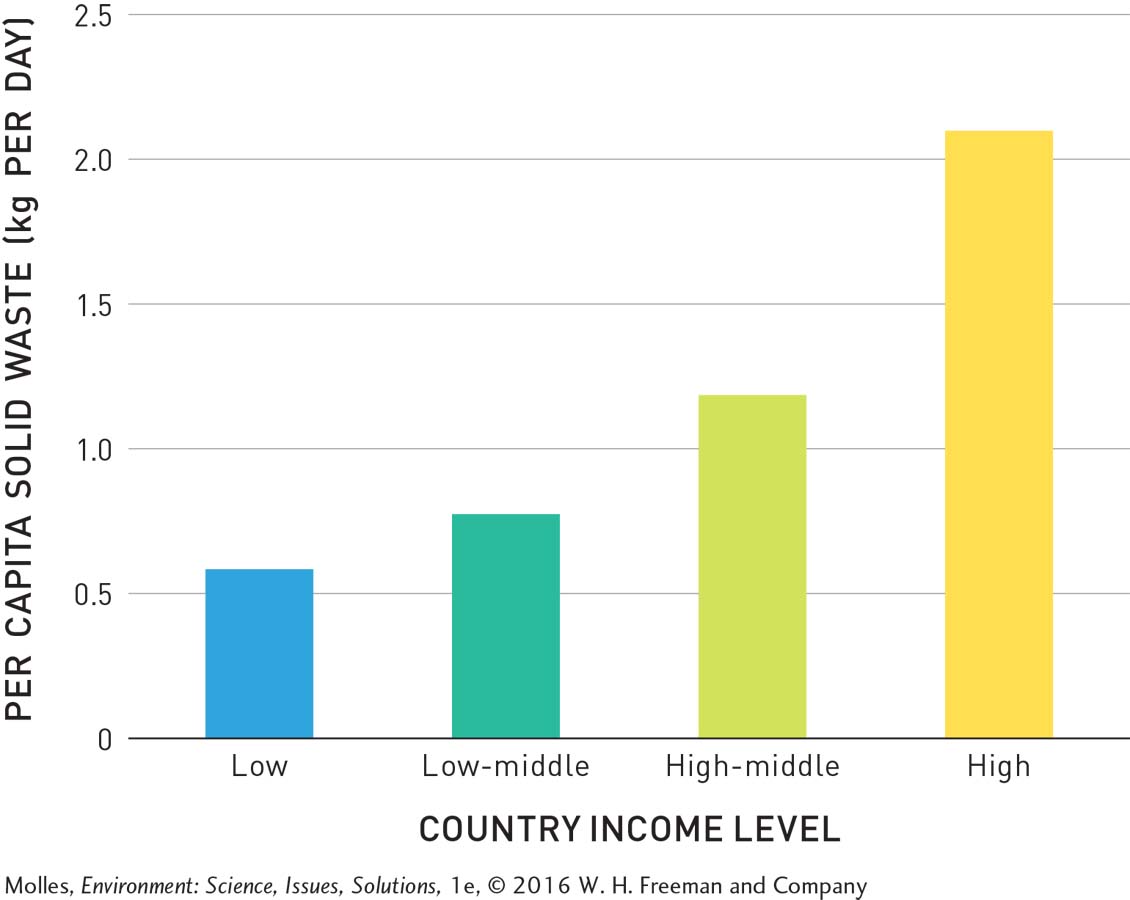
Because municipal solid waste is a product of economic activity, income level is correlated with the amount and composition of waste generated by a population. As shown in Figure 12.4, the per capita production of MSW in the world’s richest countries is triple that of the poorest countries.
There are many different types of solid waste, which must be handled differently. The World Bank classifies MSW into six categories: organic, paper, plastic, glass, metal, and other (Table 12.1).
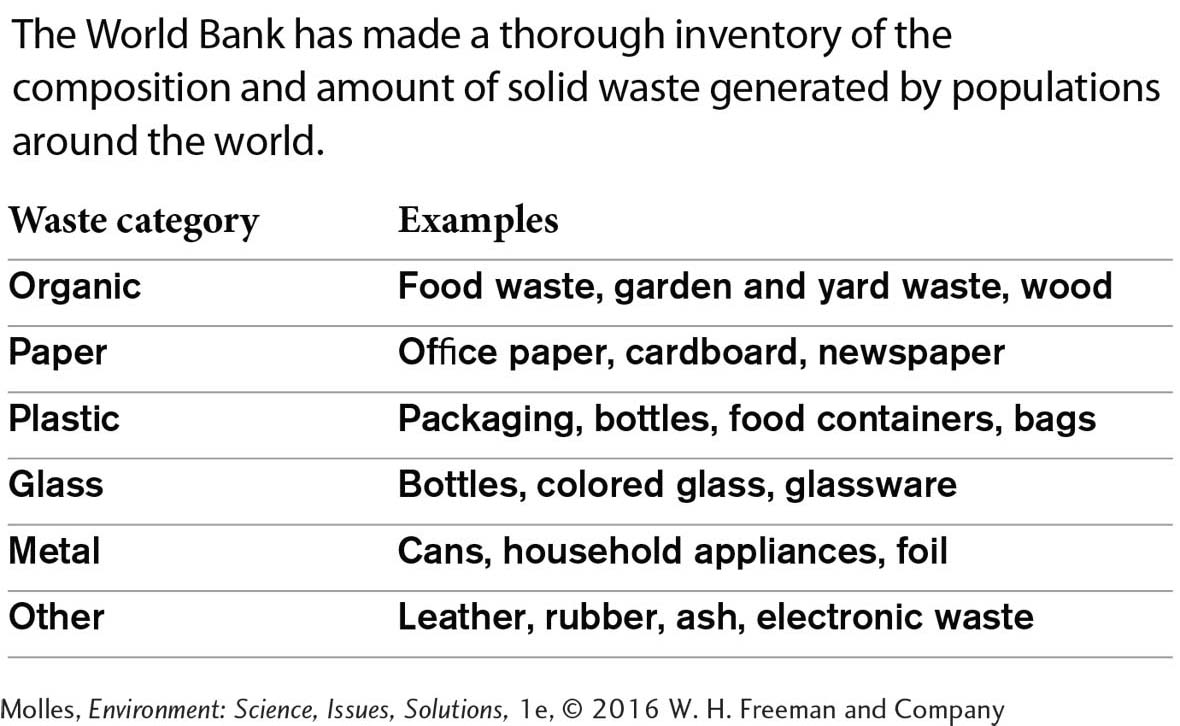
Under the World Bank’s scheme, organic waste includes food scraps, yard clippings, and wood. Paper and plastics are also chemically organic, but paper is highly processed organic material and plastics are mostly synthesized from petroleum. The “other” category includes processed organic material as well, including leather and rubber, but also appliances, electronic waste, and ash.
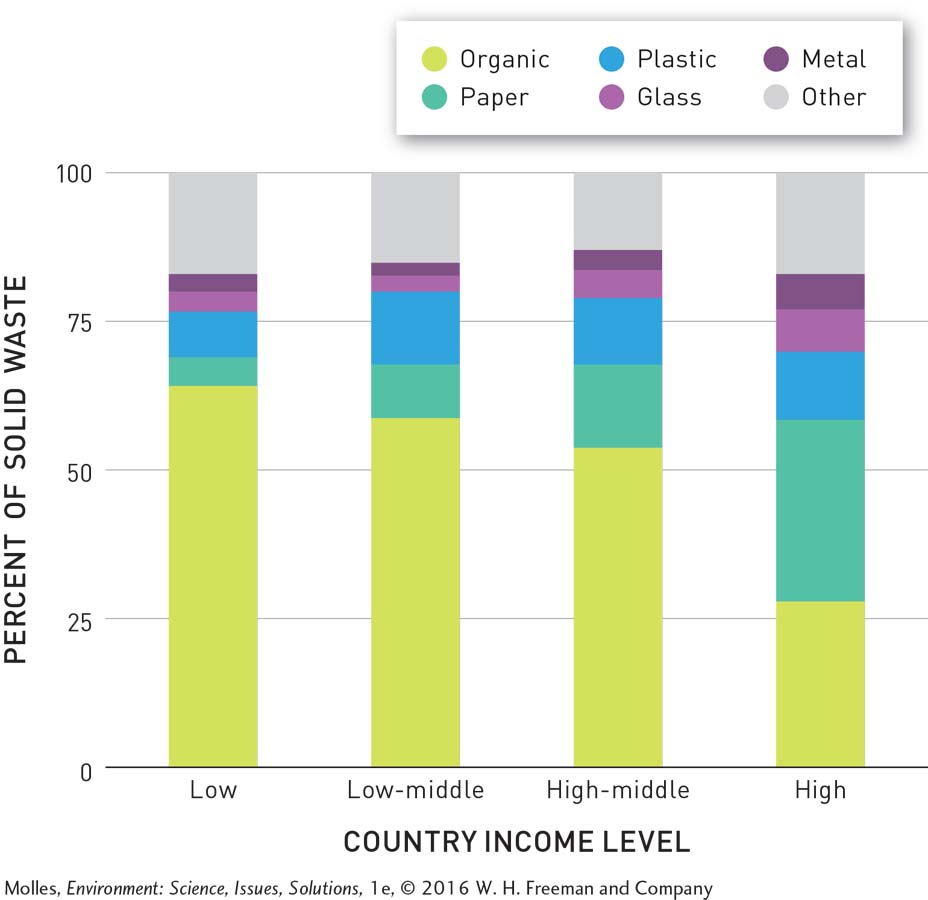
In poor countries, organic wastes such as food, wood, and garden waste make up a full 64% of municipal solid wastes. By contrast, such items make up only 30% of waste in cities of wealthy countries. Meanwhile, the proportions of paper, glass, and metal in solid waste increase with income level (Figure 12.5). We can assume that as poor nations develop economically, the generation of these types of wastes will increase.
Properties of Hazardous Waste
hazardous waste A flammable, reactive, corrosive, or toxic waste capable of causing illness, death, or other harm to humans and other organisms.
Some wastes are so dangerous and toxic that they cannot be disposed of with conventional means. The U.S. Environmental Protection Agency (EPA) defines hazardous waste as having a “chemical composition or other property that makes it capable of causing illness, death, or some other harm to humans and other life forms when mismanaged or released into the environment.” More specifically, waste material that has any of the following four properties is considered hazardous:
flammable Easily ignited; a flammable substance can ignite and burn easily (e.g., from friction, absorption of moisture, or contact with other waste materials).
1. Flammable: Substances that ignite and burn quickly and easily. These can spontaneously ignite from friction, absorption of moisture, or contact with other waste materials.
reactive Chemically responsive; a reactive substance will readily undergo a violent chemical change when in contact with other substances.
2. Reactive: Unstable substances that readily undergo a violent chemical change when in contact with other substances, especially with water.
corrosive Capable of causing permanent damage to a variety of surfaces, including living tissue; corrosive substances include strong acids (pH of 2 or less) or strong bases (pH of 12 or greater).
3. Corrosive: Any strong acids (pH of 2 or less) or strong bases (pH of 12 or greater). These substances can permanently damage a variety of surfaces, including living tissue.
toxic Poisonous; a toxic substance is harmful to living organisms in relatively low amounts.
4. Toxic: Relatively low amounts of these substances are harmful to living organisms.
363
Hazardous wastes cannot be handled, treated, or stored in the same way as other categories of waste. The risk of an explosive chemical reaction, harm to workers, or damage to lining of waste containers or landfills is simply too great. (Hazardous chemicals are also discussed in Chapter 11, as an aspect of environmental health, and in Chapter 13, as pollutants.)
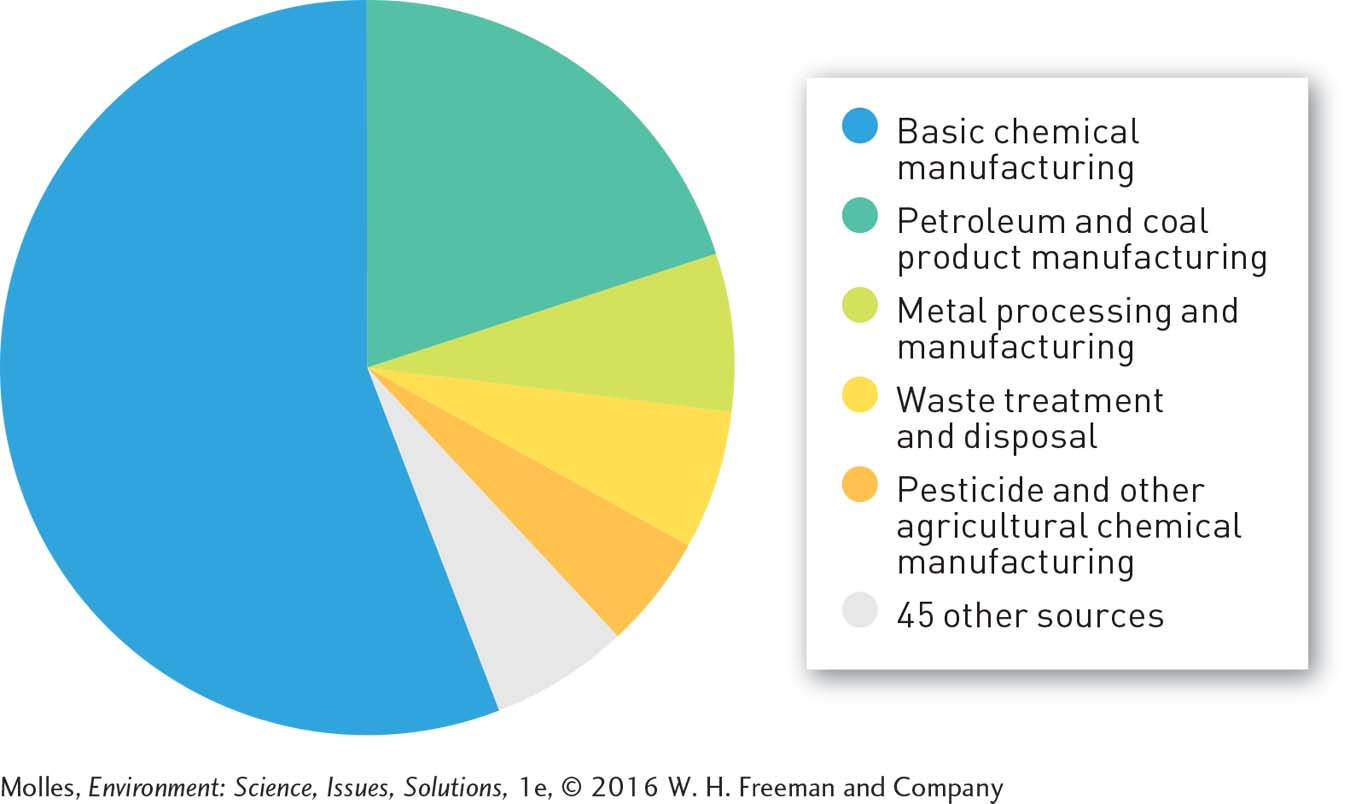
Sources of Hazardous Waste
In the United States, the “basic chemical” industry, which produces everything from nail polish remover to chlorine for swimming pools, is responsible for over half of all hazardous waste (Figure 12.6). In second place is the production of petroleum-
While most household wastes aren’t dangerous, there are some hazardous items commonly found in the home that individuals should never simply place in a trash can or pour down a drain, on the ground, or into storm sewers. For example, the following household wastes meet at least one of the EPA’s hazardous waste criteria:
Medical waste—
expired prescriptions, discarded needles, bandages (toxic) Chemical drain openers (corrosive)
Paint thinners (flammable)
Pesticides (toxic)
Used motor oil (toxic, corrosive, flammable)
Mercury-
containing products— old thermometers, fluorescent light bulbs (toxic) Antifreeze (toxic)
Batteries (reactive, flammable)

Does an increase in disposable income lead inevitably to increased per capita waste production?
Because wealthier countries tend to have greater capacity for manufacturing chemicals than do poorer countries, they tend to produce more hazardous waste. As shown in Figure 12.7, the average per capita production of hazardous waste in high-
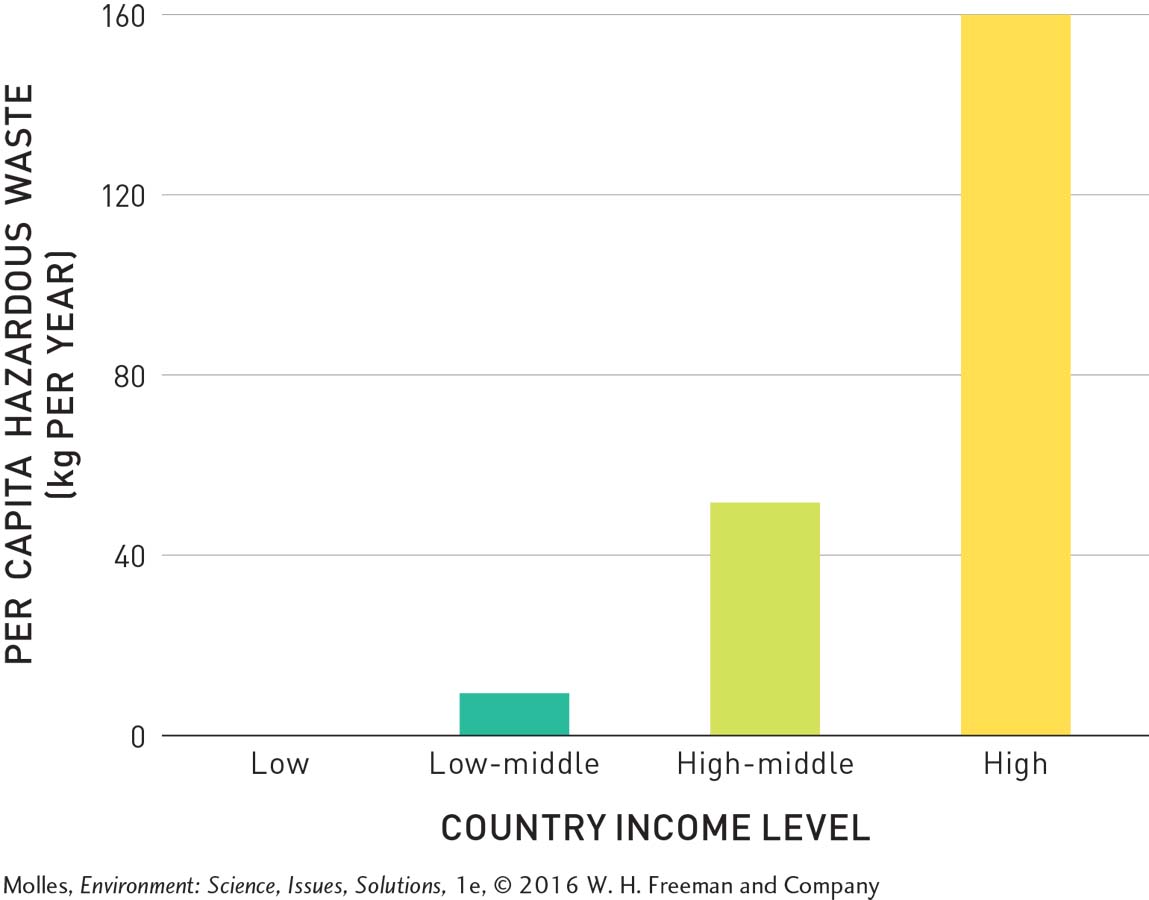
364
Does disposal of household wastes have potential ethical implications?
Think About It
What might future archeologists conclude about today’s human societies by studying our MSW?
How might income level influence the composition of waste in different countries? How do differences in income level among cities affect waste management issues?
While federal law requires industry to safely dispose of hazardous waste, individuals and households are not held to the same standards. Do you believe the EPA should extend these laws to include all waste producers? Explain why or why not.
12.1–12.2 Science: Summary
As long as human populations were small, the volume of waste they produced was low, and the waste stream consisted of natural materials. The situation changed with population growth and the development of intensive industrial economies. Municipal solid waste includes all solid waste from institutions, households, and businesses, making solid waste management one of the most critical and expensive public services. National income is correlated with the amount and composition of waste. The EPA considers waste that is flammable, reactive, corrosive, or toxic as hazardous. In the United States, the largest sources of hazardous waste are basic chemical manufacturing and the manufacturing of products from petroleum and coal, such as gasoline, plastics, and lubricants. Significant amounts of hazardous waste can also be generated in households.