12.3 Municipal solid waste management is a growing problem
12.3–
In the Chinese town of Guiyu, hazardous waste piles up on the streets as hundreds of thousands of untrained workers dismantle cast-
No one likes to take out the trash from his or her own house. But that’s just the beginning of the journey for our waste. Consider, for a moment, the epic task of gathering trash from each and every household in a city of several million and finding a place to put it. Waste collection is a critically important task because uncollected solid waste can block drainage systems and cause air and water pollution. Waste disposal is yet another issue. What happens in the long term to all that buried municipal waste? Does it ever decompose? Does any of the waste material find its way back into the soil and water systems of the nearby environment? And if so, is it toxic and therefore hazardous?
365
Municipal Solid Waste
As the odyssey of the Khian Sea showed, getting rid of waste can be a fraught process. Around the globe, the amount of municipal solid waste generated is soaring. As of 2002, just over 600 million metric tons of MSW was being generated per year; and in the following 10 years, that number doubled to 1.3 billion metric tons. By 2025 that total is expected to increase even further to approximately 2.2 billion metric tons of MSW per year (Figure 12.8a).
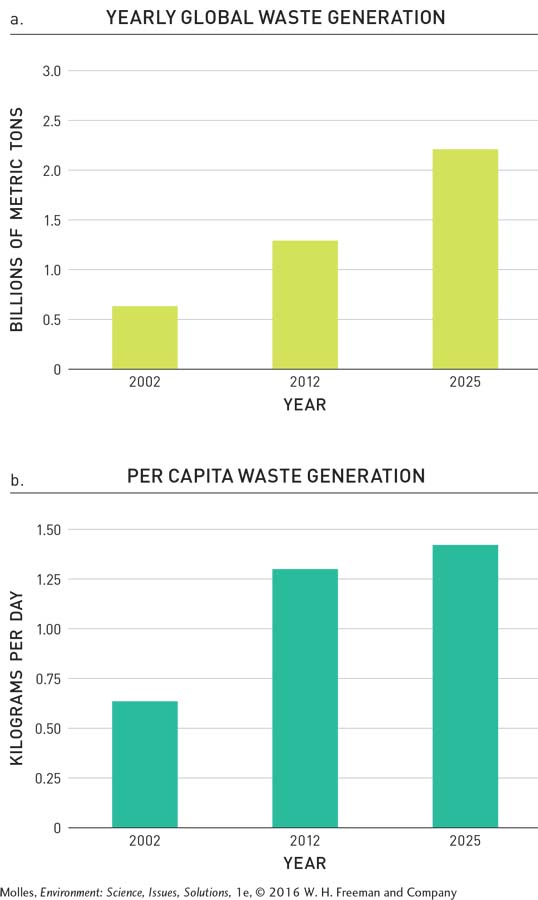
These increases represent not only the growth of urban populations around the world, but also increased economic development. As disposable incomes and living standards increase, consumption correspondingly increases. More consumption equals more trash. Between 2002 and 2012, the amount of waste an individual produced doubled from approximately 0.6 kilogram to 1.2 kilograms per day. These numbers are predicted to rise by nearly 20% by 2025 (Figure 12.8b). When you consider the increase in per capita waste production in combination with urban population growth across the globe, solid waste will have tripled between 2002 and 2025.
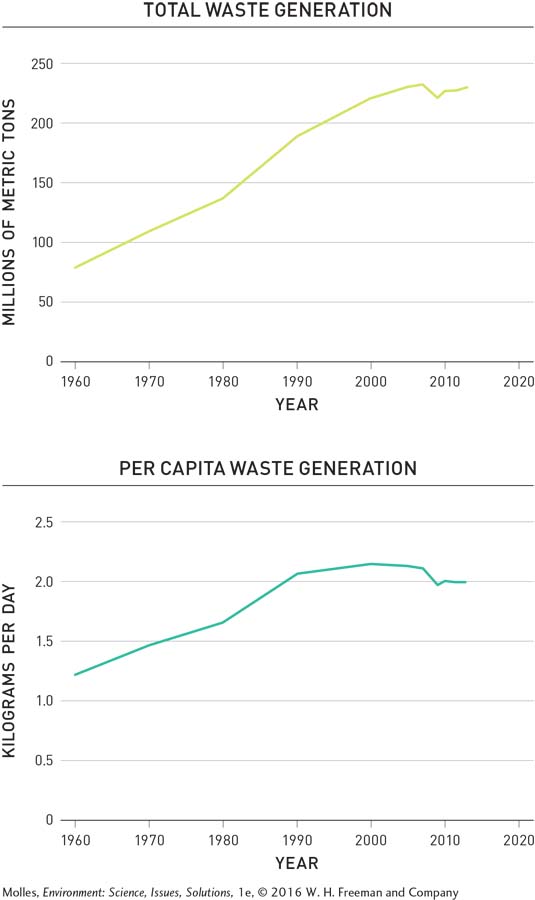
In the United States, however, we are beginning to see a slight decline, suggesting we’ve reached “peak trash” (Figure 12.9). Indeed, people today are throwing away less trash than they did 15 years ago. Let’s take a closer look at the numbers. In 1960 the United States generated 80 million metric tons of MSW; that number increased to 233 million metric tons by 2007. After 2007 solid waste generation decreased by 1.3% to 230 million metric tons by 2013. What accounted for that decline? From 1960 to 2000, people were becoming more wasteful: The per capita generation rate went from 1.22 kilograms per person per day to 2.15 kilograms per person per day. However, the per capita rate then declined 7.5% over the next decade, down to 2 kilograms per person per day in 2013.
366

How could requiring all packaging to be biodegradable change the waste stream?
According to World Bank statistics, these per capita rates of solid waste generation are comparable to those of other developed countries—
Food Waste
According to the EPA, Americans threw out approximately 35 million tons of food in 2012. That’s more than 3 times the amount we were throwing out in 1980, and it represents more than 20% of our waste stream. In fact, we throw away more food than plastic, paper, or metal. The Natural Resources Defense Council, an environmental advocacy organization, has estimated that 40% of our food goes to waste.
biodegradable A substance that can be decomposed to its chemical constituents by biological processes.
You may think that it’s no big deal because food and other organic waste are biodegradable, meaning complex molecules can be broken down into their simpler elements and compounds. Even though such waste will decompose in the long term, it is filling up our country’s landfills; and as it decomposes due to the actions of bacteria, fungi, and some species of insects, it releases climate-
Plastic Waste
non-
While some of our wastes, such as paper and food scraps, are biodegradable, others are not. All of our products begin as naturally occurring substances, including crude oil, but through manufacturing they undergo processes of heating, molding, coloring, or are chemically changed. The end products, in many cases, are non-
Because plastics are not biodegradable, they accumulate in waste dumps and, more significantly for the environment, in natural ecosystems. The Great Pacific Garbage Patch (Figure 12.10) consists of particles of plastic that have concentrated in the central Pacific Ocean due to an oceanic current known as the North Pacific Gyre (see Figure 8.2, page 232). Although the area with a significant amount of plastic waste in the Pacific Ocean is undoubtedly large, according to the U.S. National Oceanographic and Atmospheric Administration (NOAA), there is currently no scientifically sound estimate of the area of this accumulation. Garbage patches have also been found in both the Atlantic and Indian Oceans.
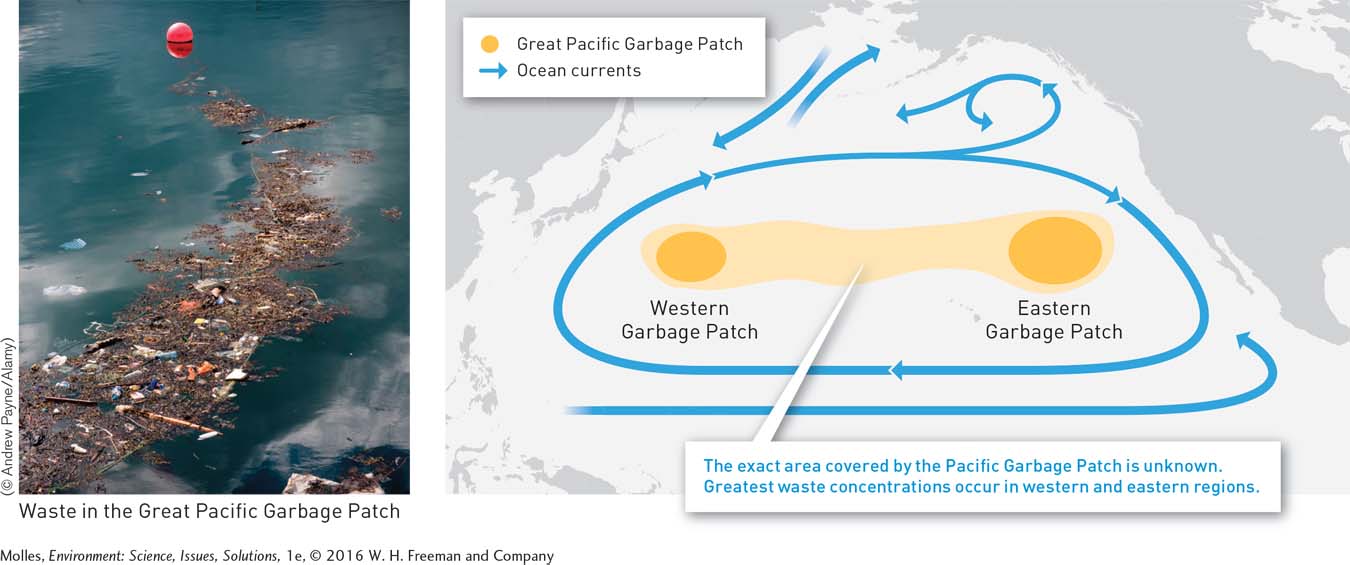
367
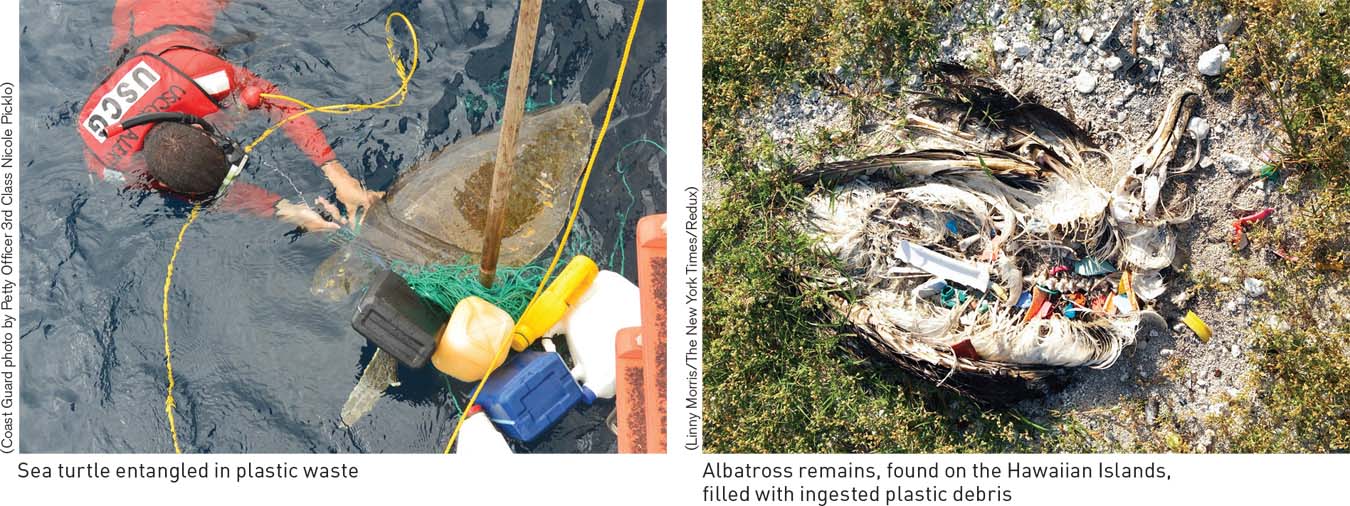
The dominant waste in all these patches is plastic, ranging in size from large chunks to microscopic particles. Because they are not biodegradable, these plastics do not decompose but rather are broken into smaller and smaller pieces by mechanical action and by sunlight. The larger pieces are hazardous to sea life, including seabirds and turtles that can become entangled and drown. Many marine animals also mistake plastic particles for their natural food, with potentially fatal consequences. A particularly hard-
The impact of this plastic waste goes beyond its physical effects. Plastic debris in the oceans allows persistent organic pollutants such as PCBs, polychlorinated biphenyls (see Chapter 13, page 392), to enter the marine food chain. While these pollutants are not very soluble in water, they adsorb on plastic particles and can be released into the tissues of animals ingesting them. Because these compounds biomagnify (see Chapter 11, page 340), their concentrations can be substantial in a variety of popular seafoods.
Whose responsibility is it to clean up the Great Pacific Garbage Patch?
Think About It
Can total waste generation by a population increase over time, while per capita waste generation declines significantly? Explain.
Why can we expect the amount of municipal waste generated around the world to continue to increase for the foreseeable future?
What does the impact of plastics on Laysan albatrosses tell us about the municipal solid waste stream?