14.5 Precise measurements reveal that fossil fuel burning is the main cause of increased atmospheric CO2 levels
14.5–
In the early days of our species, it was inconceivable that we could alter the climate system. Our numbers were too few and our impacts immaterial. However, a growing body of scientific evidence demonstrates that human activity is responsible for increasing the levels of greenhouse gases in Earth’s atmosphere. In response, global temperatures are increasing, accompanied by other aspects of climate change. The changing climate has already caused shifts in species’ geographic distributions and damaged important natural ecosystems. Unchecked, climate change threatens further impacts, ranging from species’ extinctions and agricultural failures to the displacement of human populations.
On May 18, 1955, Charles David Keeling, a young postdoctoral researcher, set up camp near a coastal river in California’s Big Sur State Park.
Keeling was a young chemist and outdoor enthusiast interested in learning how carbon dioxide moved between water and air, as part of a geological study of limestone. There in the sheltering redwoods, Keeling was having such a good time, he took water and air samples every few hours throughout the day and night, far more than he needed. He went back to his university, the California Institute of Technology, with some surprising findings—
First, he found that the CO2 concentration in the forest air changed on a daily cycle. It decreased during the day, as plants took in CO2 to make sugar during photosynthesis, and increased during the night due to respiration by plants and other organisms. Second, he determined that CO2 concentrations in air were about the same everywhere he made measurements in the afternoon: 310 parts per million (ppm). No one had ever measured CO2 in the atmosphere so consistently and so precisely before.
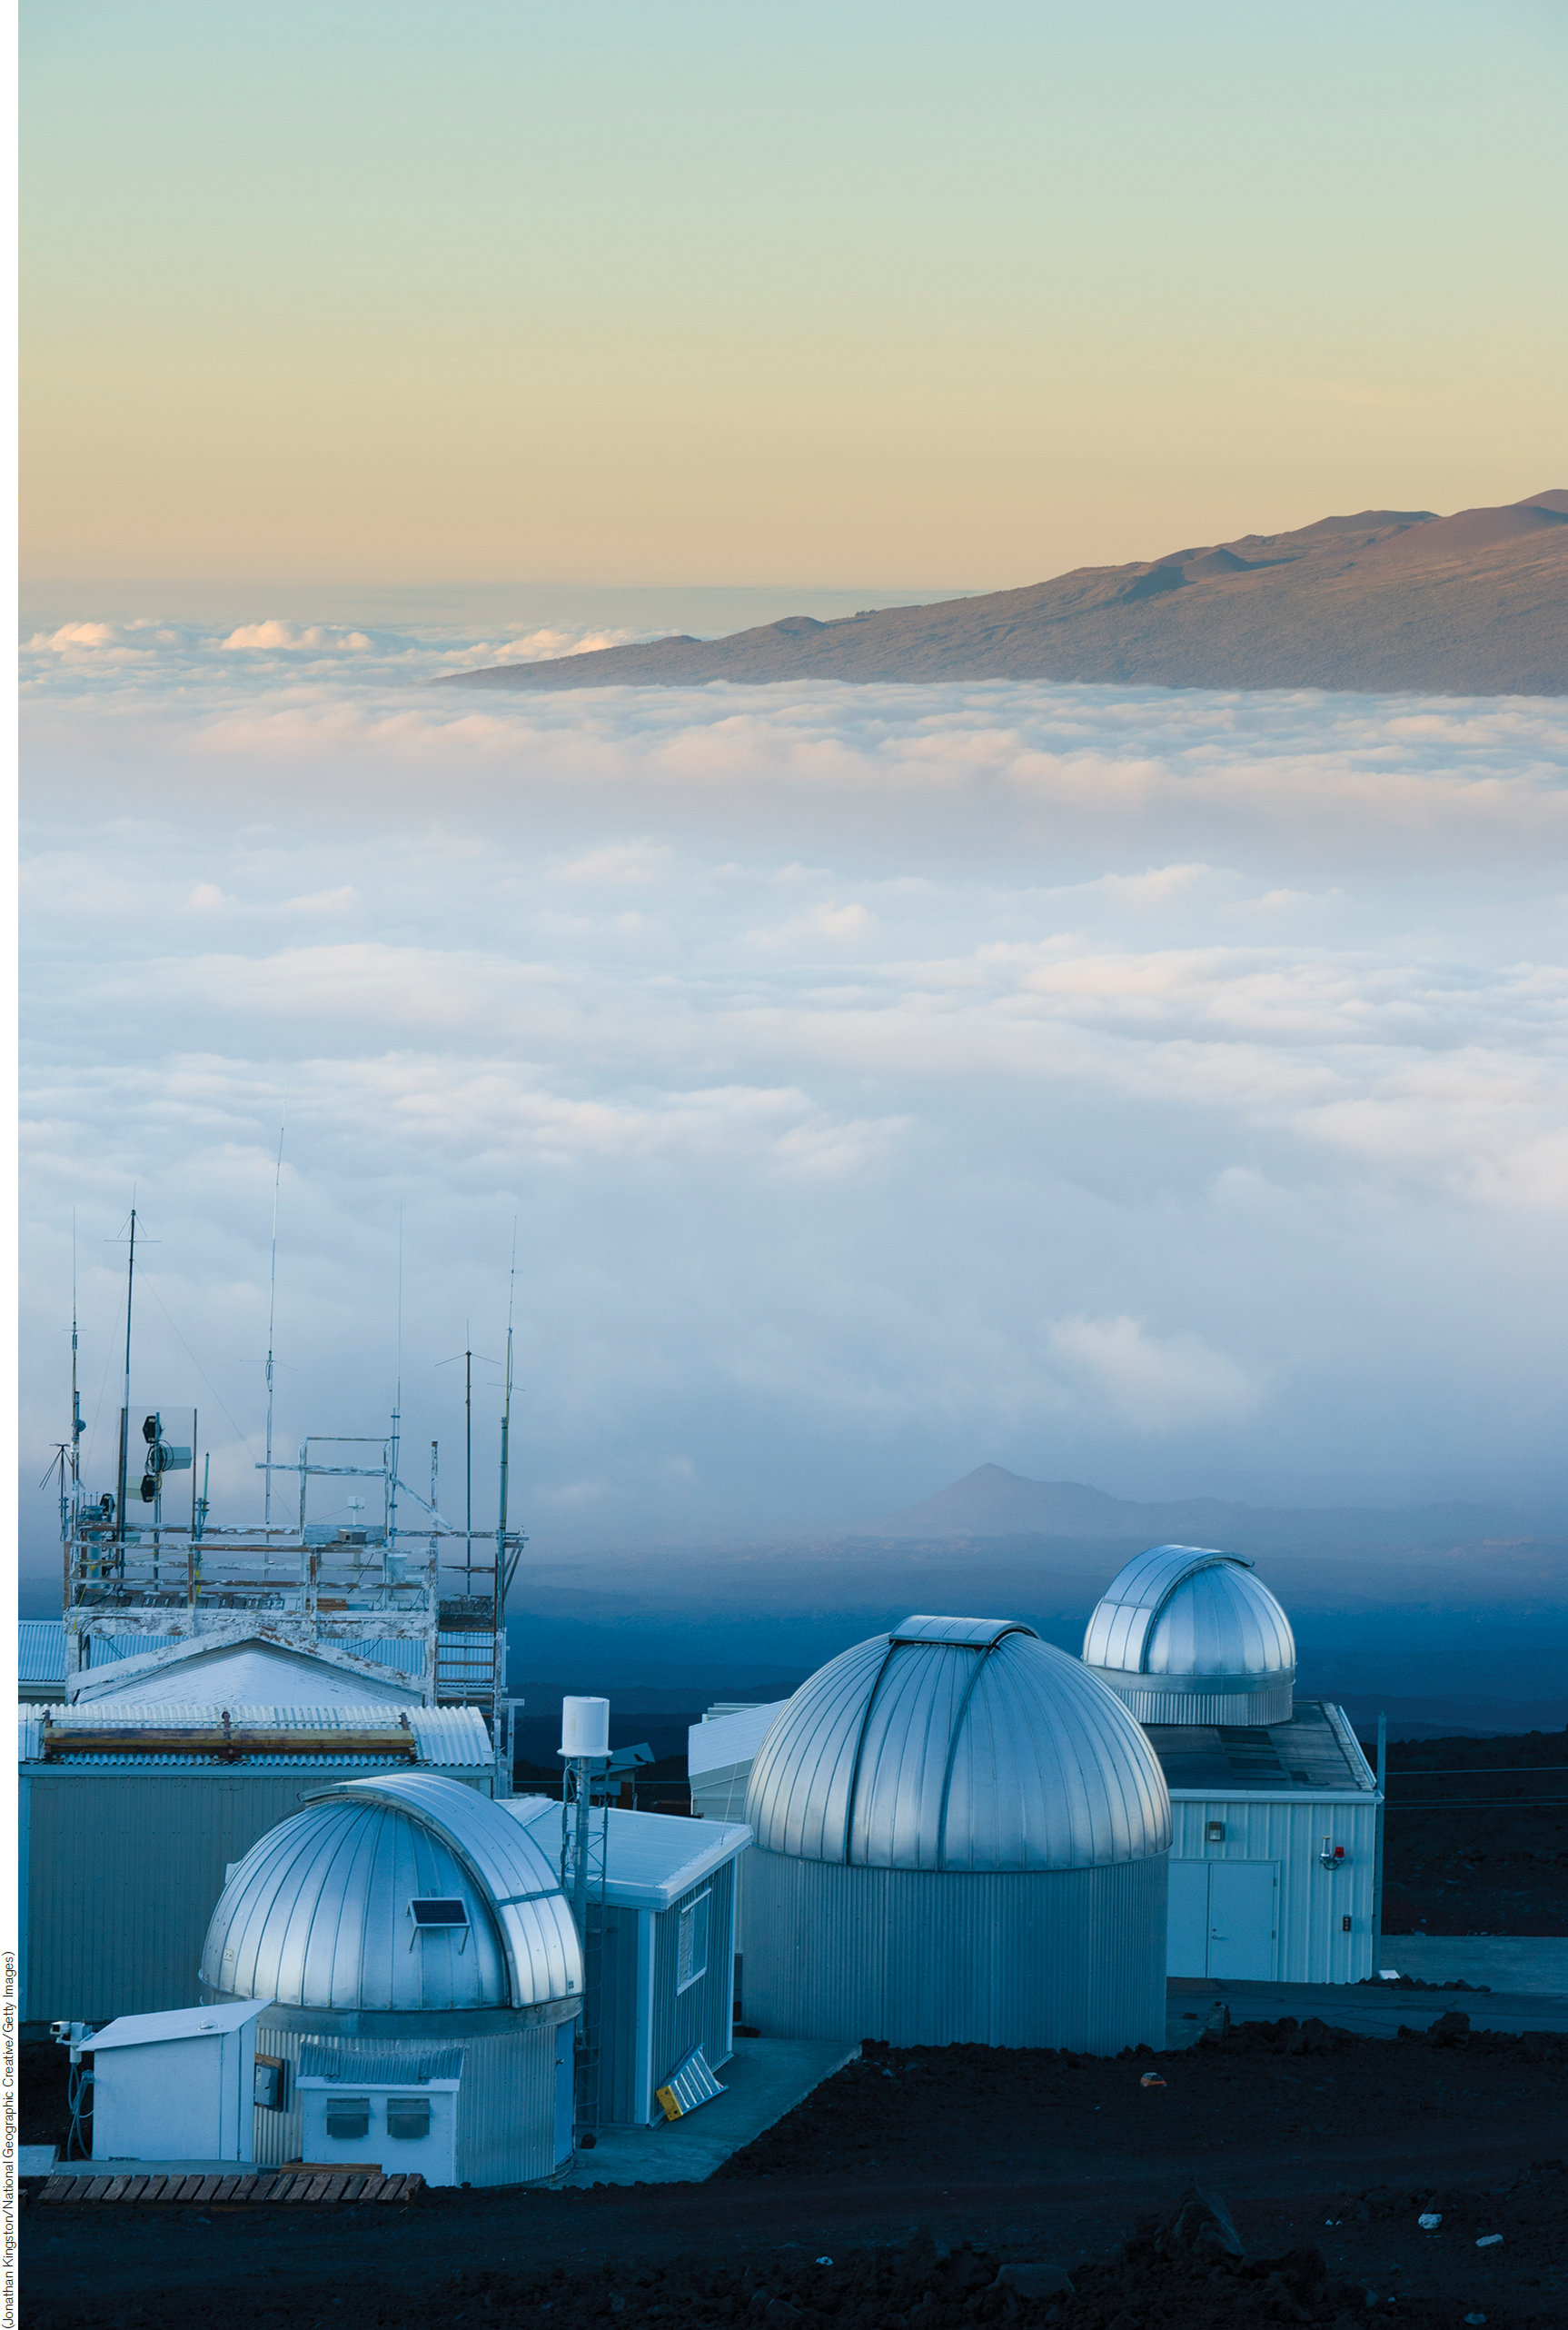
Word of Keeling’s groundbreaking work soon found its way to Harry Wexler at the U.S. Weather Bureau. Wexler offered him a chance to measure atmospheric CO2 around the world, including at a new observatory located at 3,397 meters (11,138 feet) on Mauna Loa, a volcano on the island of Hawaii (Figure 14.14).
Mauna Loa and the Keeling Curve
At the time Keeling began his measurements, there was widespread disagreement in the scientific community about the atmospheric effects of fossil fuel burning. The prevailing idea was that the vast oceans, which actively exchange CO2 with the overlying air, would be capable of rapidly absorbing excess atmospheric CO2. Scientists saw Keeling’s precise measurements as a way to settle the debate.
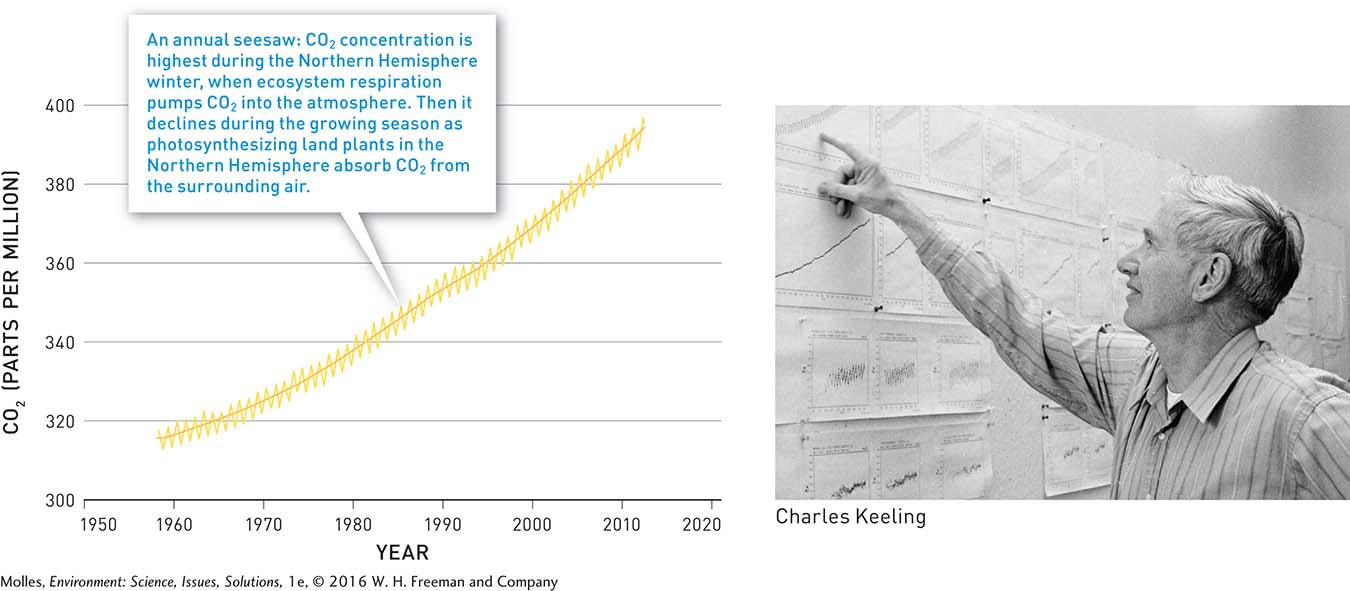
Keeling’s first two years at Mauna Loa produced a sawtooth plot showing CO2 rising and falling with each season. The reason for this sawtooth pattern is that the concentration of CO2 reaches a maximum during each Northern Hemisphere winter as respiration by all the organisms that make up ecosystems pump CO2 into the atmosphere. Then it declines during the Northern Hemisphere growing season as plants come out of dormancy and rates of photosynthesis increase across the northern continental landmasses. As Keeling continued taking these measurements over the next 50 years, he saw the sawtooth curve gradually rising at Mauna Loa. By 2012 atmospheric CO2 had increased by approximately 25%. This striking graph is what we now call the Keeling Curve (Figure 14.15).
441

Why was Keeling’s carbon dioxide detector set in Hawaii of all places?
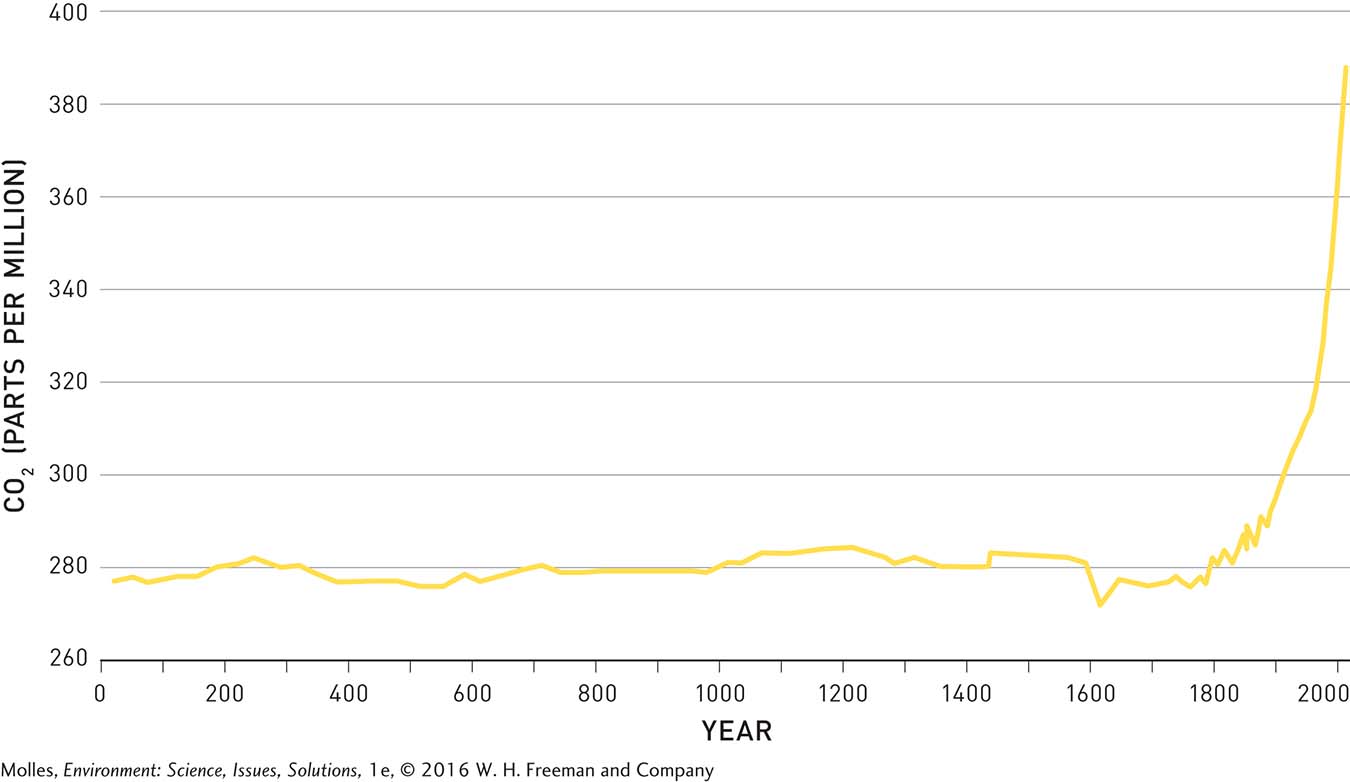
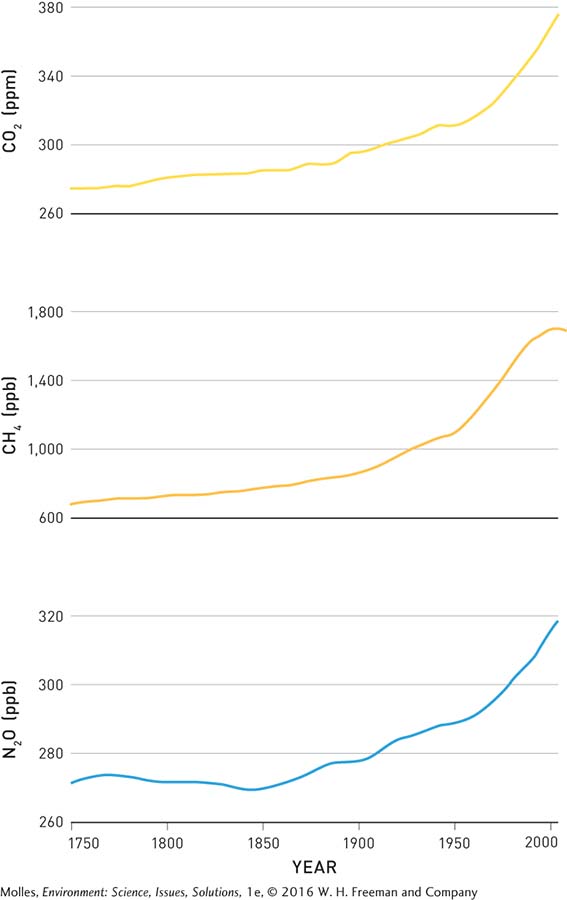
The dramatic modern increase in atmospheric CO2 becomes especially apparent when we look back in time, again using the ice record. As shown in Figure 14.16, atmospheric CO2 oscillated around an average of about 280 ppm for approximately 1,800 years and then began rising with increased fossil fuel use during the Industrial Revolution, which began in the late 18th century, just as Svante Arrhenius predicted it would—
Carbon Isotopes and Fossil Fuels
Because fossil fuel emissions are not the only source of carbon dioxide in Earth’s atmosphere, alternative hypotheses are that the rise in CO2 concentrations might be due to volcanic eruptions or might result from emissions from the oceans. Volcanic eruptions can be discounted as the source of increased atmospheric carbon dioxide since fossil fuel burning releases over 100 times more CO2 to the atmosphere. How about the oceans as the source? Scientists can answer this question by looking at the ratio of two carbon isotopes in the atmosphere, 13C to 12C, which Keeling had also measured in Big Sur.
Because plants preferentially take in the lighter 12C isotope from the air, plant biomass, and therefore the CO2 emitted by plants during respiration, has a higher relative concentration of 12C than occurs in the atmosphere. At Big Sur, Keeling could see that the 13C isotope decreased in relative concentration at night, when the plants respired and weren’t absorbing carbon dioxide during photosynthesis, and increased in relative concentration during the day when the plants photosynthesized, removing 12C-
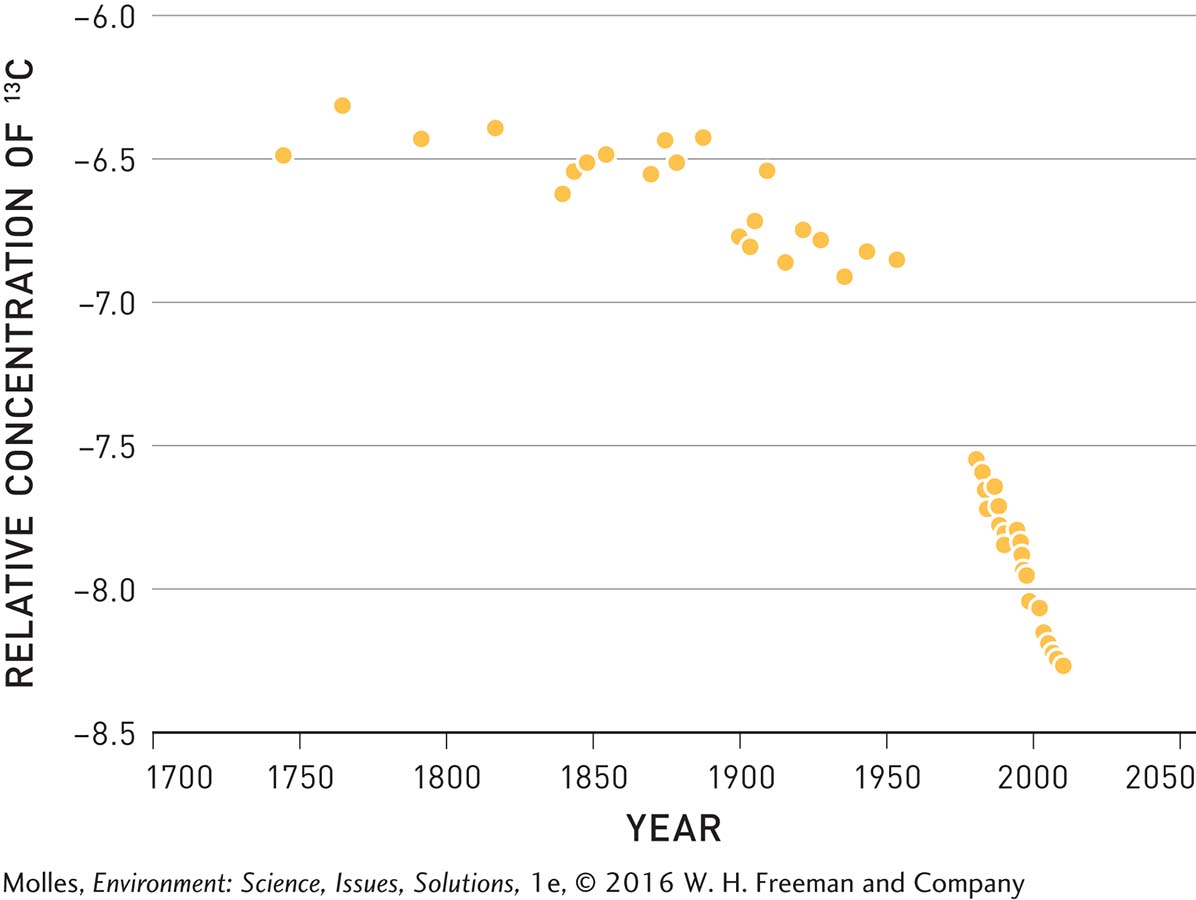
The relative concentrations of 13C and 12C can also be used to determine the source of increased atmospheric CO2 over the past two centuries. Because fossil fuels formed over millions of years out of compressed plant biomass, the carbon dioxide released when fossil fuels combust also contains relatively low concentrations of the 13C isotope compared with that in the atmosphere. In contrast, carbon dioxide in the oceans has the same ratio of 13C to 12C as the atmosphere. If atmospheric CO2 increases are the result of fossil fuel burning, which is relatively rich in 12C, the relative concentration of 13C should begin to decline after the Industrial Revolution in 1800—
Meanwhile, other greenhouse gases—
443
Think About It
Looking at the Keeling Curve, how many years did it take to be sure that carbon dioxide was rising?
How do we know that the increase in carbon dioxide over the last 50 years has resulted from fossil fuels?