14.6 As CO2 levels have risen in modern times, global temperatures have increased significantly
Because the burning of fossil fuels over the last 200 years has increased carbon dioxide concentrations in the atmosphere, Earth should be warming via the greenhouse effect. Indeed, four climate research groups—
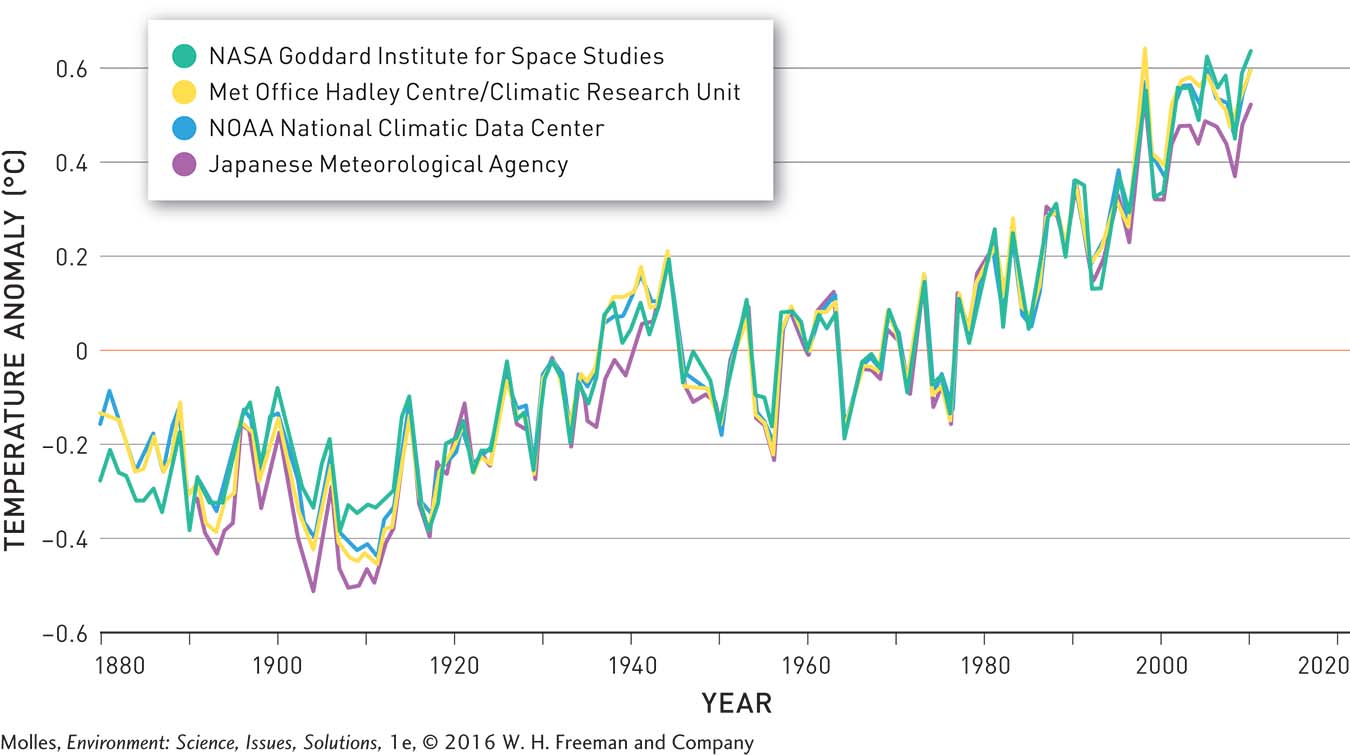
The relatively smooth increase in atmospheric concentration of CO2 (see Figure 14.18) contrasts sharply with the considerable variability in global temperatures shown in Figure 14.19. This contrast suggests that factors other than greenhouse gases significantly affect global temperatures, at least in the short term. One of the main sources of this discrepancy is the El Niño Southern Oscillation (ENSO), which we reviewed in Chapter 6 (see page 161). For instance, the peak in global temperature around 1942 was associated with a strong El Niño, and the subsequent declines that followed were associated with several La Niña episodes in the 1950s. Similarly, the exceptionally strong El Niño of 1998 brought about a spike in global temperatures and was followed by a La Niña episode, which reduced global temperature. Such influences are not surprising, since ENSO events involve the massive transport of heat stored in the Pacific Ocean. However, these short-
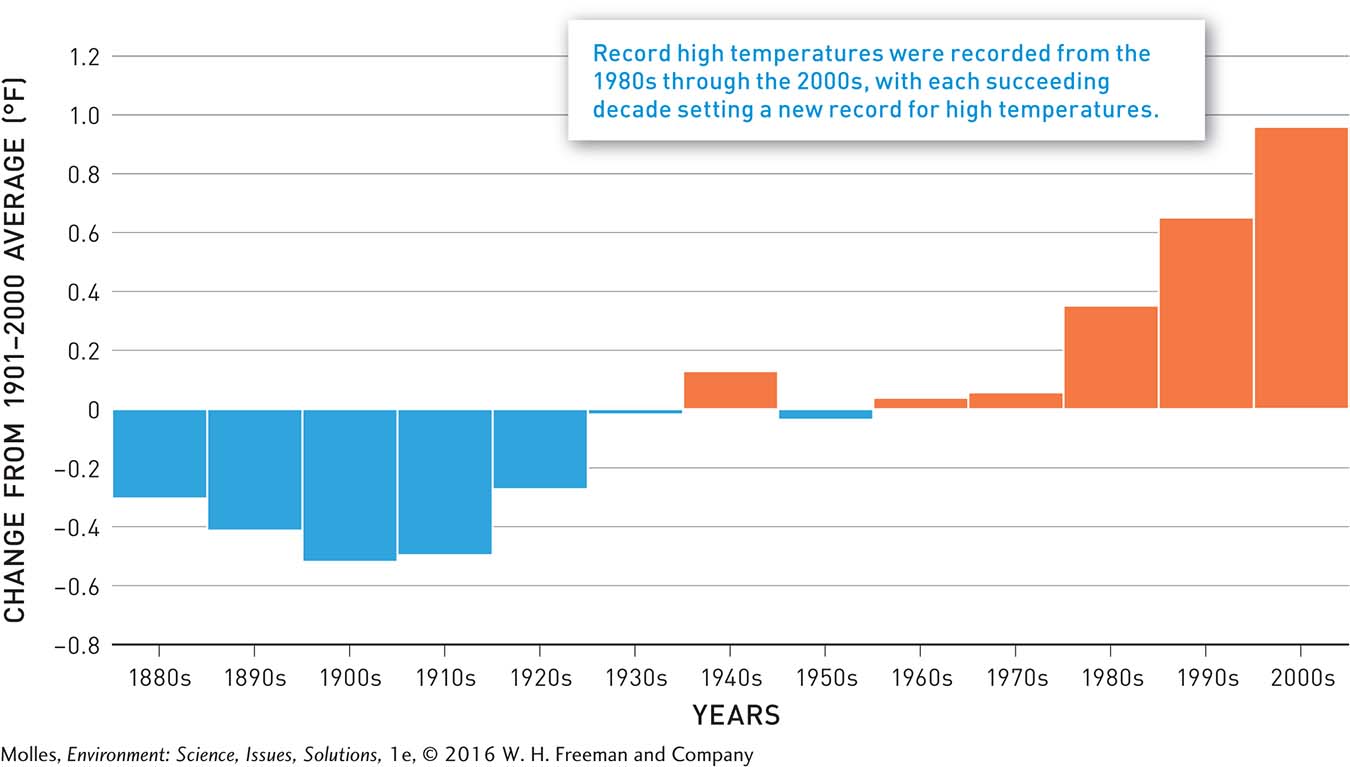
The increase in global temperature becomes even more apparent in a plot of temperatures averaged by decades (Figure 14.20). By removing the higher-
Consequently, the warming of the globe shows no signs of flagging. By the end of the 21st century, climate models suggest that the temperature of Earth’s surface is expected to rise between 2° and 3°C, according to the IPCC.
Reanalysis and Confirmation of the Temperature Record
Although it may seem like a trivial matter to measure air temperature in a single spot over time, several criticisms have been leveled at attempts to test whether Earth as a whole is really warming.
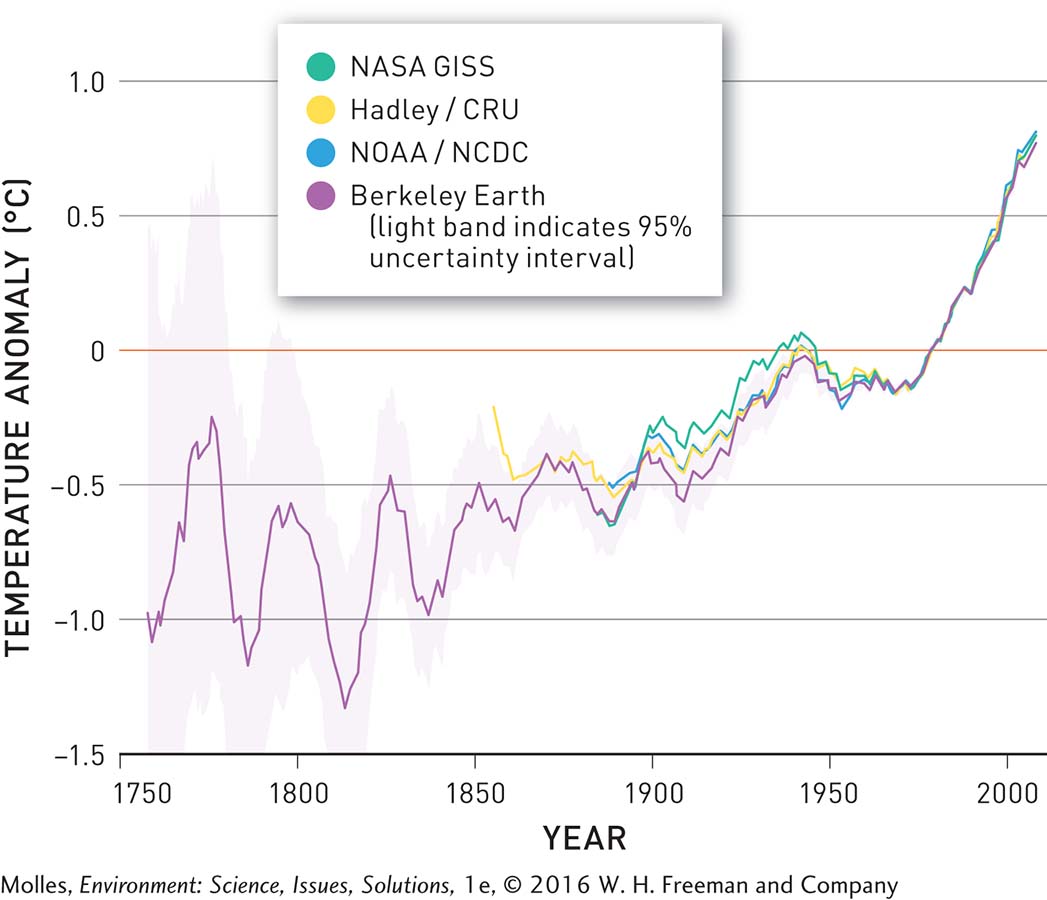
Some critics have pointed out that weather stations are mostly located in urban areas, which have become “urban heat islands” over time because asphalt and cement absorb a lot of heat. In addition, the quality of the monitoring process varies from station to station, which raises the possibility that these records are inaccurate. Some critics argue that only data from the best sites should be included in global estimates. Others say the opposite: Climate researchers have been too selective in their choice of data sources. If the records from more weather stations were included, they argue, the warming pattern would disappear.
To settle the question, Richard A. Muller at the University of California at Berkeley organized the Berkeley Earth Surface Temperature (BEST) study. Muller, who was himself a skeptic of global temperature estimates, compiled weather records from 36,000 land-
445
Think About It
Why is it important that four scientific groups analyzed the temperature data?
What are some reasons why scientists might be skeptical of global warming?
What are some reasons why politicians might claim to be skeptical of global warming?