Rates of Reproduction
Reproductive rates vary widely among species. For example, a plains cottonwood tree produces approximately 25 million seeds per year (Figure 3.10). In contrast, a Bay checkerspot butterfly lays an average of about 730 eggs during its one season of life. Female mountain gorillas generally give birth to one offspring once every four years. Expressed in terms of births per 1,000 females per year, mountain gorillas have a reproductive rate of approximately 250 births per 1,000 females per year, whereas the annual rate of reproduction for the Bay checkerspot butterfly population is approximately 730,000 eggs per 1,000 females per year. The great contrast between species in reproductive rates translates into great differences in potential for population growth.
SHOWERING THE ENVIRONMENT WITH OFFSPRING
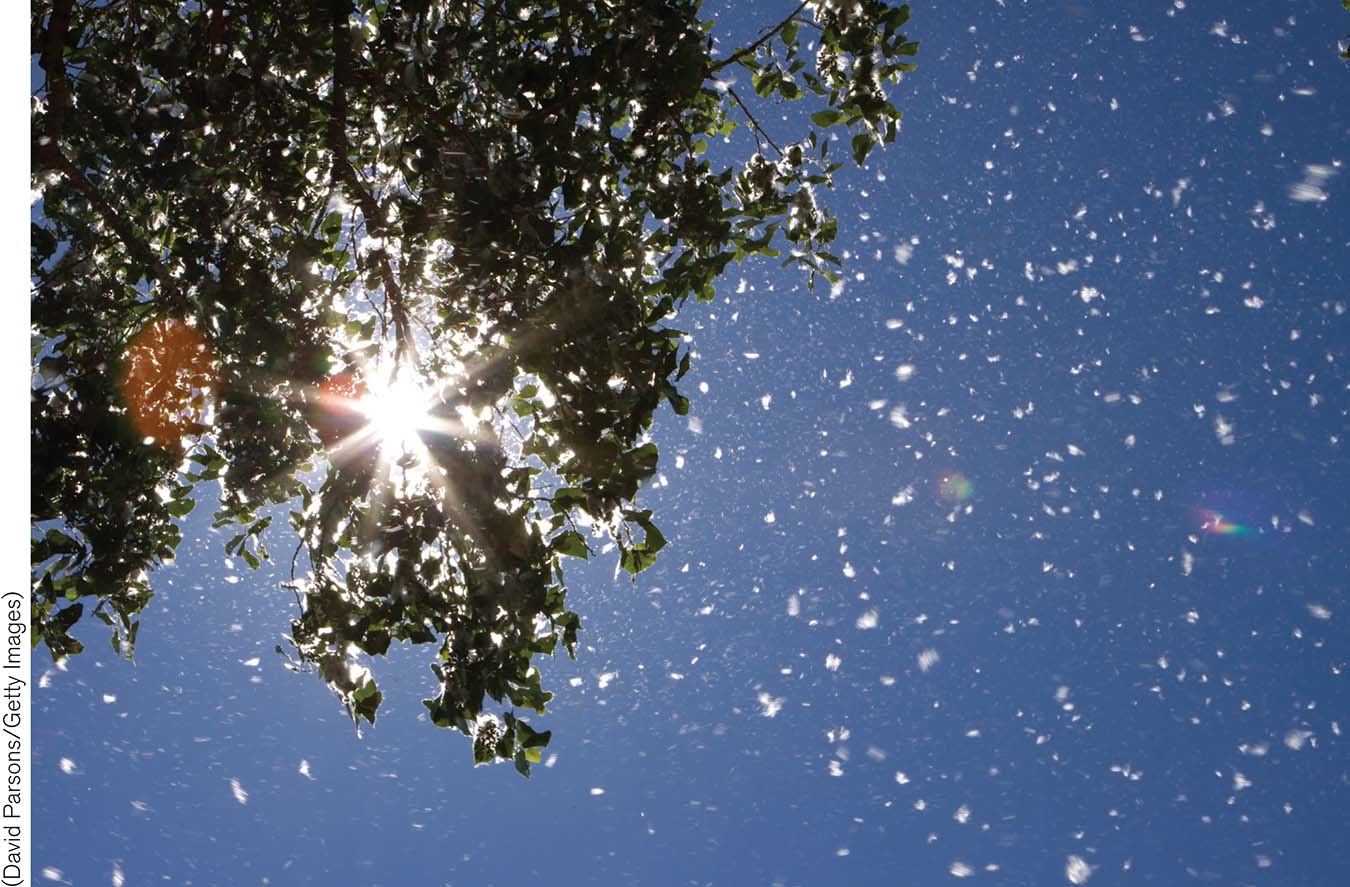
FIGURE 3.10 Female plains cottonwood trees, Populus deltoides, produce millions of tiny wind- and water-dispersed seeds each year. A few seeds among these millions will land on sites where they can germinate and grow to a mature tree.
(David Parsons/Getty Images)
Population Growth
J-shaped (exponential) population growth Population growth that occurs at a constant, or fixed, rate per capita and that produces a characteristic J-shaped pattern of increase in population size over time.
Populations can grow in one of two stereotypical ways. The first pattern ecologists recognize is J-shaped population growth, which is also called exponential population growth. During exponential growth, a population grows by a fixed rate, called r, the rate of population increase per capita (per individual); this is calculated as the birthrate minus the death rate. The population growth rate can also be expressed as a percentage of population size, for example, 4% per year. As long as the rate of growth remains fixed, the size of the population will increase faster and faster over time, because each year the population is larger, producing the characteristic J-shaped pattern of population growth (see the orange line in Figure 3.11).
J- AND S-SHAPED POPULATION GROWTH
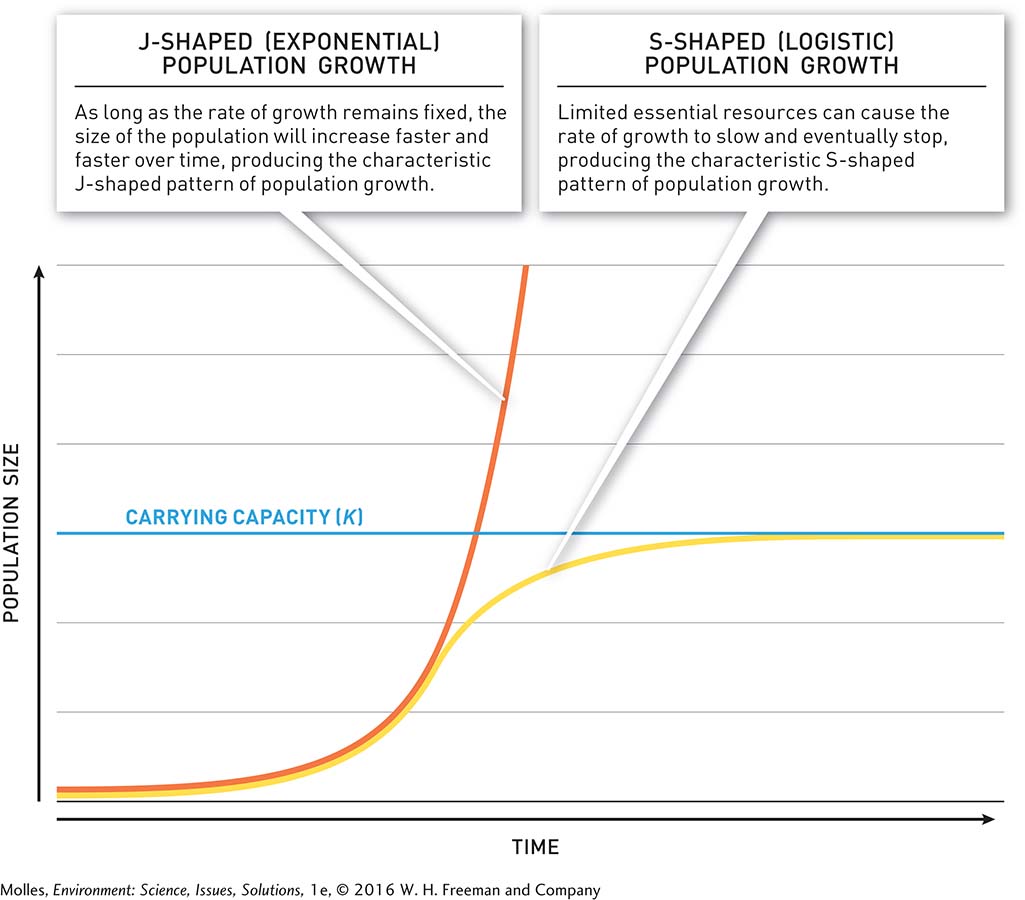
FIGURE 3.11 While those populations showing J-shaped growth continue to increase, those undergoing S-shaped growth stop growing when something limits the continued growth of the population—predators, limited food supplies, finite habitat space, and so on. The maximum size of a population able to survive over the long term in a particular area is called the carrying capacity.
We often see exponential growth when a population is living at a low density and environmental conditions, including climate and food resources, are favorable. For example, Rocky Mountain bighorn sheep reintroduced to the Wheeler Peak Wilderness in northern New Mexico grew at an average rate of approximately 28% annually for seven years. At this constant rate, the population grew from 32 adults to 180. Because a fixed 28% is added to the population annually, the number of individuals added, in this case each year, increases. Continued exponential population growth would increase the size of this population to more than 4,000 in just 20 years, producing a J-shaped pattern of growth (Figure 3.12).
POPULATION OF ROCKY MOUNTAIN BIGHORN SHEEP IN THE WHEELER PEAK WILDERNESS, NEW MEXICO
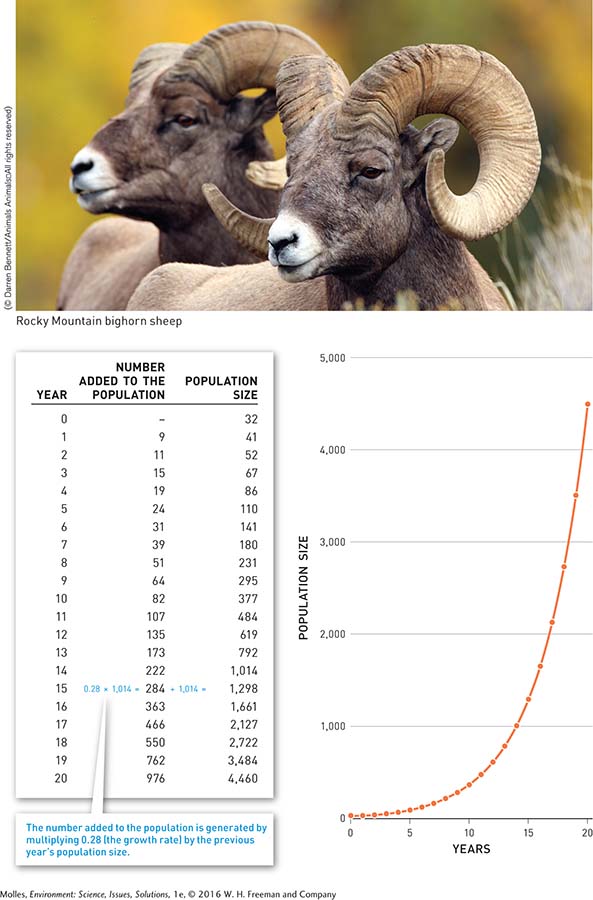
FIGURE 3.12 The population grew exponentially at a fixed rate of 28% per year, from 32 to 180 individuals in seven years (numbers rounded to nearest individual); the population growth shown from 180 to 4,460 sheep is potential growth, assuming a continued constant rate of exponential growth. Growing exponentially, this population would increase by nearly 140 times in 20 years. (Data from Rominger et al. 2004)
(© Darren Bennett/Animals Animals–All rights reserved)

If the per capita rate of increase, r, is held constant, why does a population grow faster and faster over time during J-shaped (exponential) population growth?
S-shaped (logistic) growth Population growth in which the per capita rate of growth decreases with increasing population size as a result of predation or reduced availability of food, space, or other resources; eventually levels off at carrying capacity.
J-shaped growth cannot continue indefinitely, since the population would eventually exhaust essential resources such as energy, space, and nutrients. As such resources are depleted, the per capita rate of growth decreases, resulting in a plateau of population size. This is what ecologists call S-shaped, or logistic, growth (see the yellow line in Figure 3.11). If the bighorn sheep population shown in Figure 3.12 continues to grow, the sheep would strip their mountain home of its plant cover. Dwindling food supplies might slow population growth and eventually stop it, unless some other factor such as disease or predators did so first.
carrying capacity (K) The number of individuals in a population that an environment can support over the long term.
The population size at which S-shaped population growth stops is called the carrying capacity, generally abbreviated with the letter K. Populations approaching carrying capacity may not necessarily level off as they approach K, but may “overshoot” it before declining again.
For an animal population, the carrying capacity may be determined by food supply, the number of nesting sites or breeding territories, or access to shelter from predators or severe weather. For a plant population, the factors determining carrying capacity include the availability of nutrients, water supply, or access to light. Carrying capacity differs from one species to another. For example, population biologists estimate that the carrying capacity of bighorn sheep in the Wheeler Peak Wilderness is approximately 180, or 3.5 individuals per km2 (9 per mi2). By contrast, the Wheeler Peak Wilderness might support a single mountain lion, one of the main predators of bighorn sheep.
Because carrying capacity is determined by environmental conditions, it may vary over time. During periods of abundant rain, deserts may support high levels of plant growth, which, in turn, supports large populations of small herbivorous mammals, mainly rodents. However, droughts in these same deserts may last for a decade or more and reduce the carrying capacity of both plant and herbivore populations.
Controls on Population Size
Most populations tend to fluctuate around some average number, which is typically at or below the carrying capacity. For instance, during the last half of the 20th century, the mountain gorilla population on the Virunga Volcanoes ranged between approximately 250 and 450 individuals (Figure 3.13). Meanwhile, a population of the Bay checkerspot butterfly on Jasper Ridge on the Stanford University campus ranged from fewer than 100 to approximately 5,000 individuals.
CONTRAST IN POPULATION DYNAMICS
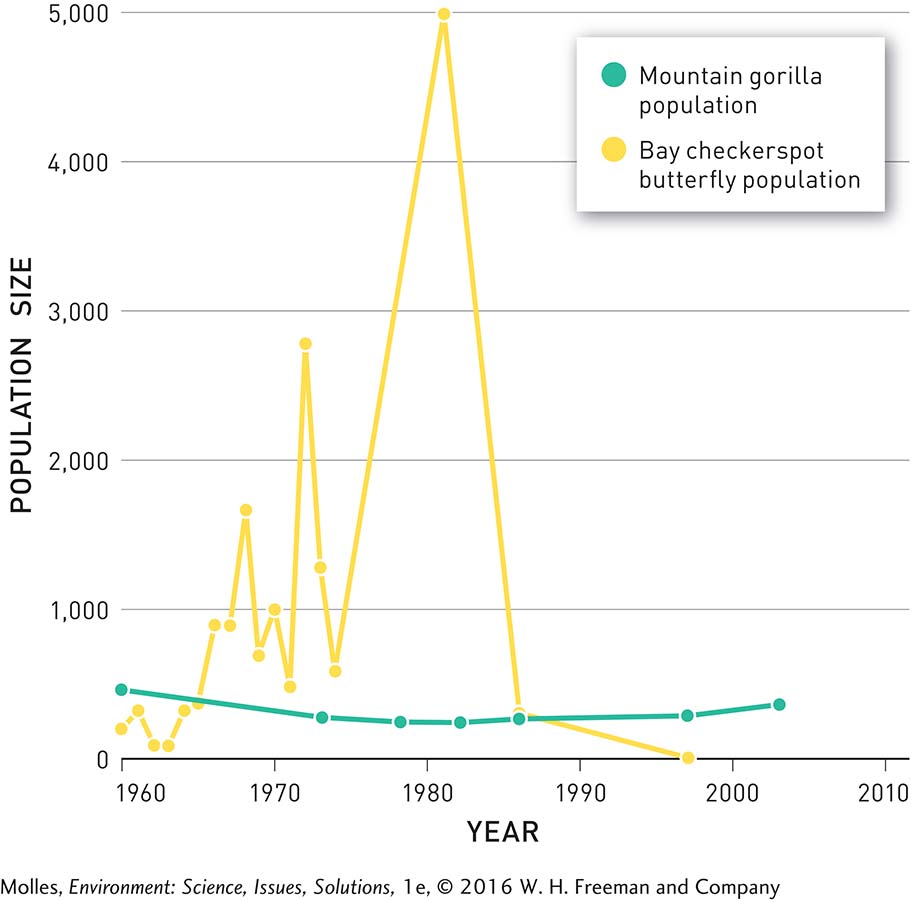
FIGURE 3.13 The population of mountain gorillas on the Virunga Volcanoes has varied by 200, from a low of 250 to a high of 450 individuals. Meanwhile, the number of Bay checkerspot butterflies on Jasper Ridge varied by nearly 5,000, from 80 to 5,000 between 1960 and 1997, when it became locally extinct. (Data from Labine 1968, Robbins et al. 2006)
Such fluctuations are the result of interactions between factors that promote growth and reproduction and factors that suppress them. Soil moisture promotes growth in plants, whereas abundant food might signal to animals that it is time to reproduce. By contrast, infectious disease or a hard frost might limit growth.
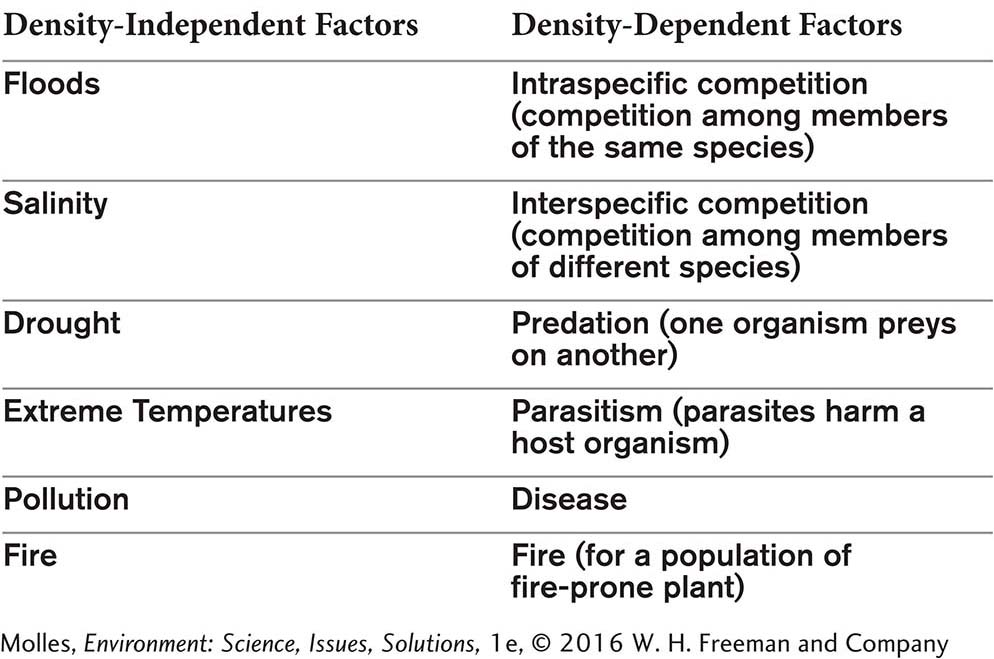
density-dependent factors Mechanisms of population control that change with the density of a population (e.g., infectious disease, predation).
Mechanisms of population control that change with the density of a population are called density-dependent factors. Infectious disease is considered a density-dependent factor because it can more easily spread through a population living at high densities than one living at low densities. Similarly, predation pressure also increases with population density as predators focus on areas with lots of prey.
density-independent factors Controls on populations that are not affected by population density (i.e., physical aspects of the environment such as drought, floods, and extreme temperatures).
Density-independent factors are controls on populations not affected by population density (Table 3.1). Generally, they include physical aspects of the environment such as drought, floods, and extreme temperatures.
TABLE 3.1
LIST OF COMMON DENSITY-INDEPENDENT AND DENSITY-DEPENDENT POPULATION-REGULATING FACTORS
How could mountain lions preying on bighorn sheep act as a density-dependent population-regulating factor? What other environmental factors might be important in regulating populations of bighorn sheep?
All populations are subject to both density-dependent and density-independent factors, but the relative importance of each varies substantially from one population to another. For instance, the chief causes of death recorded among mountain gorillas are density dependent, including disease, parasitic infections, and occasional predation by leopards. By comparison, Bay checkerspot butterfly populations are more subject to density-independent factors, particularly weather conditions.
Think About It
In Section 3.3, we have emphasized the influence of birth and death rates on population growth. How might migration affect population growth?
How can fire act as a density-dependent control factor for some species and not for others?