5.4 Fertility ranges greatly among countries and regions
5.4–
134
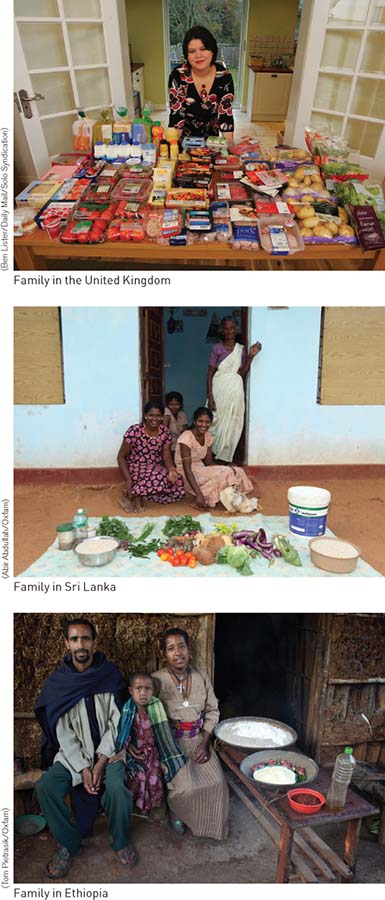
The human population and the demands it makes on the environment lie at the core of environmental science. The food we eat, including the variety, its level of processing, and the amounts, is one the most fundamental indicators of consumption by a population. Figure 5.7 contrasts the foods consumed by three families during a typical week. This stark contrast shows clearly that the pressure a population puts on Earth’s resources is a product of not just the size of a population, but also the rate at which individuals in a population consume resources. Typically, the level of resource use in a population increases with economic development.

Is population planning more of a global or regional problem? Perhaps both? Explain your answer.
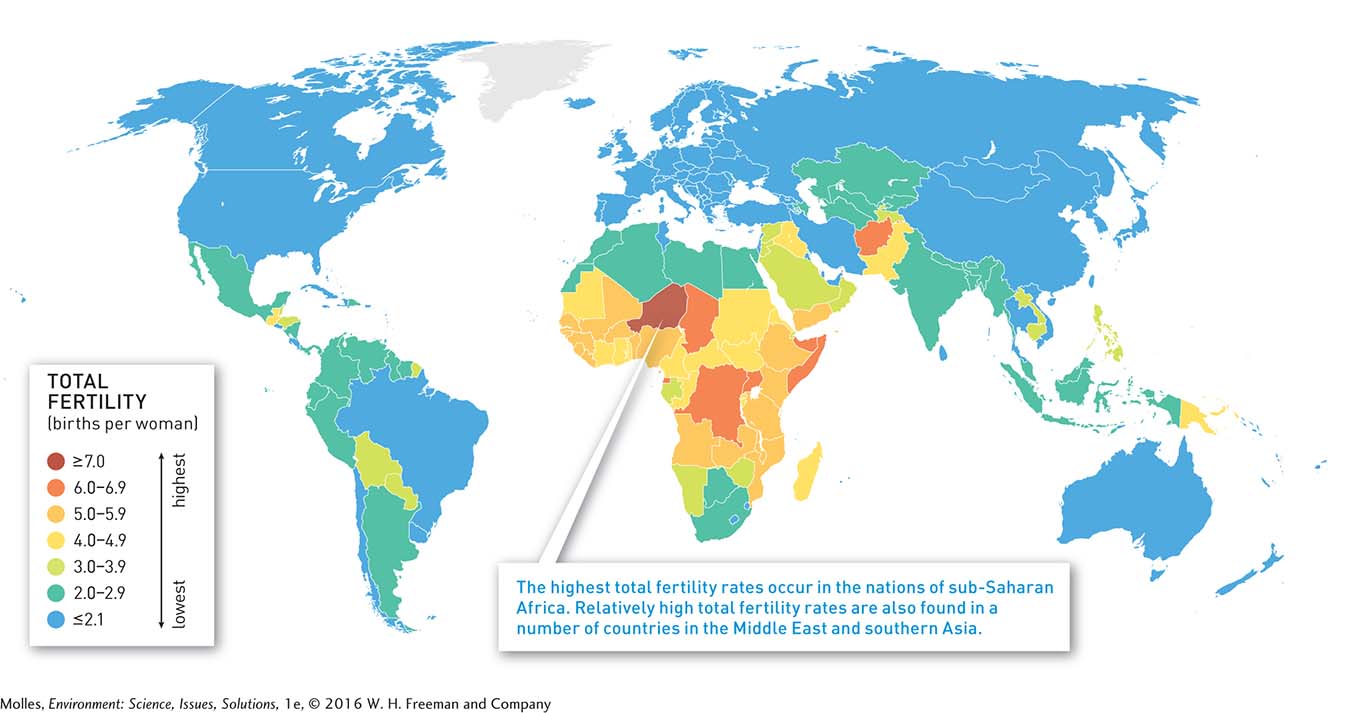
In 2007 developed countries around the world had total fertility rates at or below the replacement level of fertility of 2.1 (Figure 5.8). Consequently, populations in these countries, such as those of Iceland and Ukraine, are now generally stable, approaching stability, or decreasing in size. Meanwhile, high levels of fertility and rapid population growth, as in Yemen, continue in many nations of sub-
If you were planning for social services, what changes would you need to anticipate over the next 40 years in sub-
Each of these population trends presents a unique challenge. Populations with very low levels of fertility have a shrinking workforce of younger people who face the prospect of supporting a larger number of aged individuals in the population. On the other hand, high levels of fertility mean a large number of young in need of education, proper nutrition, and health care.
As a consequence of differences in fertility and population momentum, population trends differ a great deal among regions (Figure 5.9). Studies by the United Nations and others indicate that Europe’s population will decline over the next half-
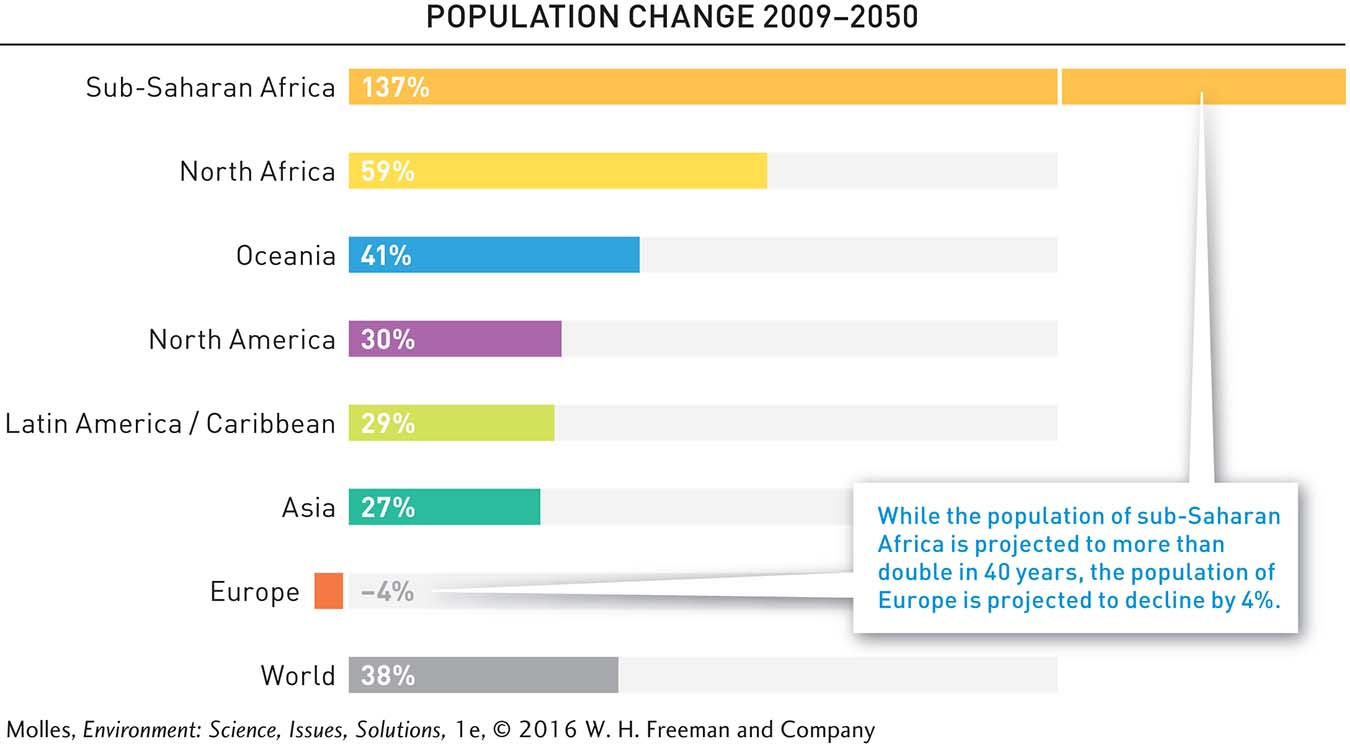
135
Think About It
What types of age structure do you think you’d find in sub-
Saharan Africa? In Europe? (Hint: See Figure 5.4.) Which regions have the highest total fertility rates? Which regions have the greatest variation in total fertility rates among countries?