5.5 Development varies widely among countries
136

The king of Bhutan proposed that noneconomic aspects should be given greater emphasis in evaluating development and proposed an index called the “Gross National Happiness.” How would you go about assessing happiness?
As discussed earlier, Bangladesh is one of the world’s poorest and least developed countries, which obviously has a wide range of consequences for the population in terms of its health, educational level, and quality of life. Those consequences are also reflected in the population’s impact on the environment. Compared with the average American, a Bangladeshi citizen uses far fewer resources. He eats less meat, requires less electricity, and is less likely to throw out an old cell phone in order to buy the latest model. Still, because of Bangladesh’s high population density, the population’s local impact on its surroundings has already been significant: polluted water supplies, dirty air, and vanishing farmland.
Development, therefore, is a double-
Measuring the Health and Well-
gross domestic product (GDP) The total market value of all the goods (e.g., manufactured articles or agricultural crops) and services (e.g., transportation and banking services) produced within the borders of a nation during some period of time. See per capita GDP.
per capita GDP The market value of the goods (e.g., manufactured articles or agricultural crops) and services (e.g., transportation and banking services) produced within the borders of a nation per individual in its population.
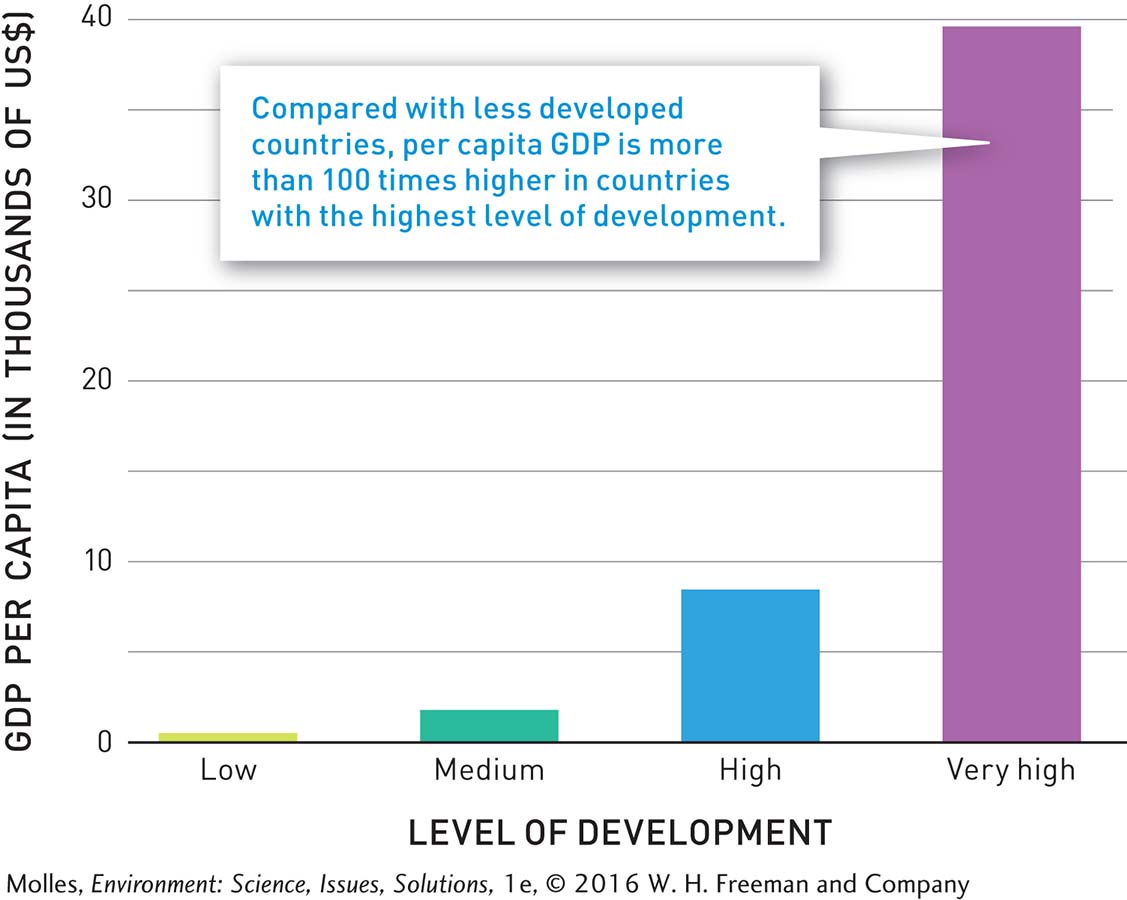
When it comes to development, the basic currency is money: how much people make and how much they spend. After all, the more money they have available, the more choices they have over the lives they lead. Economists typically compare countries based on their gross domestic product, or GDP, which is the total market value of all the goods and services produced within the borders of a nation during a given year. To compare economic conditions among countries, we divide GDP by population size, resulting in per capita GDP. As shown in Figure 5.10, per capita GDP is over 100 times higher in countries with the highest levels of development compared to those with the lowest development. Bangladesh has a per capita GDP of $1,883, which puts it above quite a few African countries, but far below the $49,965 per capita GDP of the United States. Countries with a low GDP generally have a lower cost of living. However, importing manufactured goods and food from richer countries can be a challenge.
life expectancy at birth
The predicted average life span of individuals born during a particular year.
To take a closer look at what money really means for development, it’s often useful to examine population statistics. For instance, life expectancy at birth, the predicted average life span of individuals born during a particular year, reflects the state of health in different regions and countries. In highly developed countries, life expectancy at birth averages 80 years. Compare that with many countries in sub-
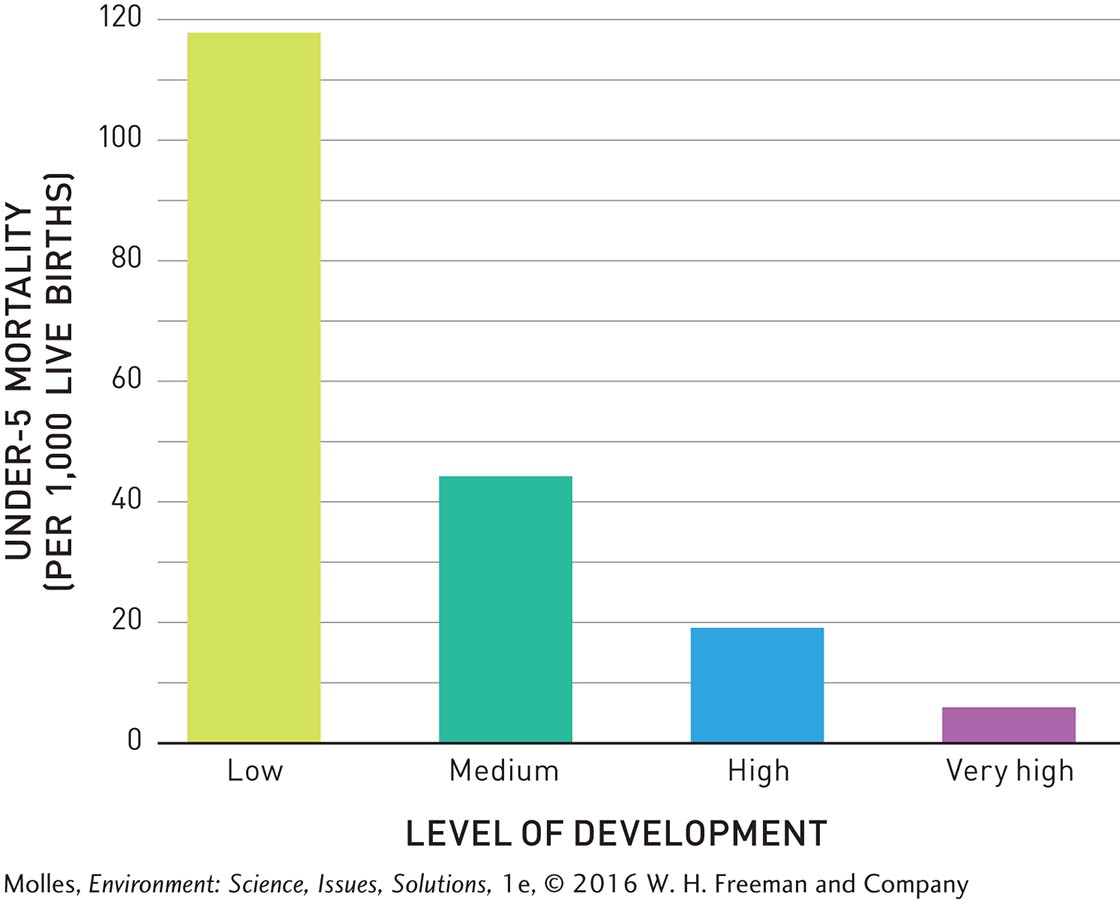
child mortality rate The number of infants per 1,000 live births who die before reaching 5 years of age.
Another measure of health is child mortality rate, the number of children per 1,000 live births that die before reaching 5 years of age. The level of child mortality can be as much as 20 times higher in the poorest countries than in the richest ones (Figure 5.11).
The poorest countries often have the worst educational systems, and many children never learn to read. Lack of educational opportunities may be one of the key impediments to improving the lives of people in such countries, while high levels of literacy and commitment to education are essential to sustaining high levels of development in rich countries.
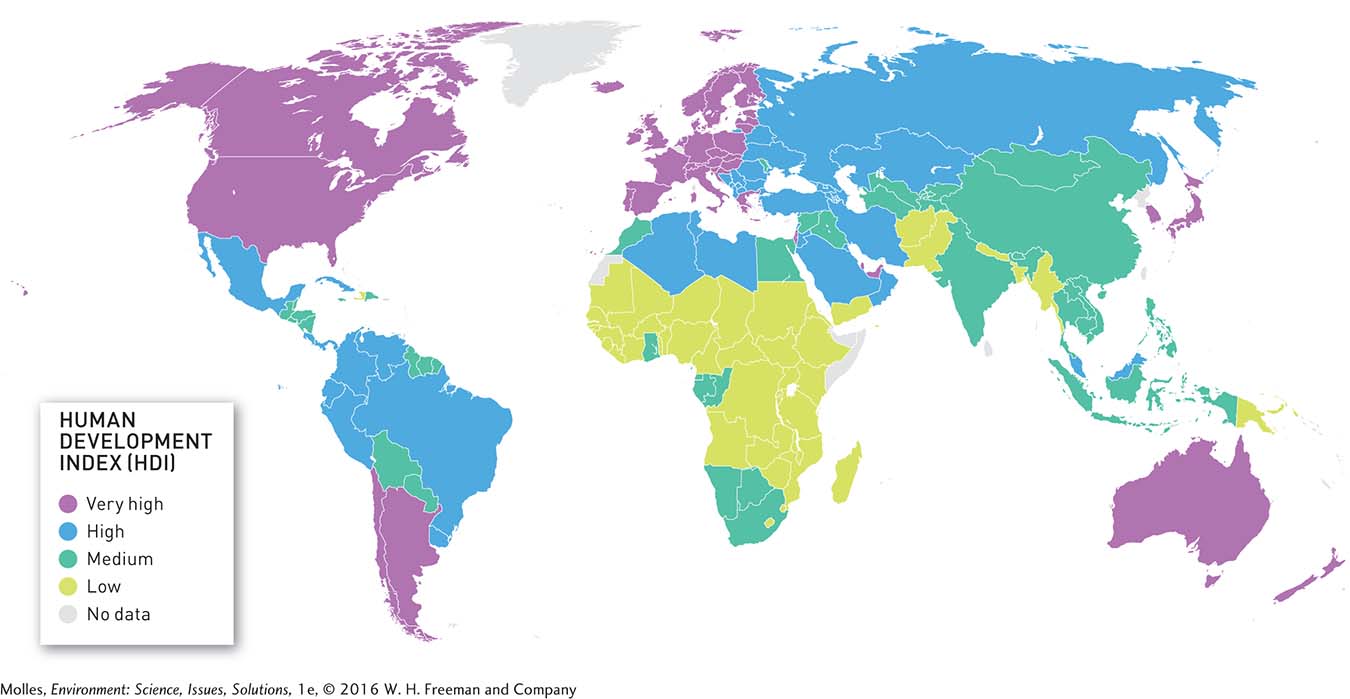
Human Development Index (HDI) An index of national development that includes life expectancy at birth, educational opportunities, and economic productivity.
As you might imagine, although a country’s GDP is the engine that drives development, a country’s history and politics also have significant influences. To gauge levels of development, the United Nations (UN) combines health, economic development, and education into the Human Development Index, or HDI. The HDI ranges from 0 to 1.0, a theoretical situation in which the health, education, and economic potential of individuals are all maximized. The HDI uses life expectancy at birth as an indicator of health in a population, average number of years of schooling as an indicator of educational opportunities, and per capita income as a measure of economic development. When the UN evaluated 187 countries in 2011, their HDI values ranged from 0.286 for the Democratic Republic of the Congo, which ranked 187th, to 0.943 for Norway, which ranked 1st (Figure 5.12). Bangladesh ranked 146th.
137
The Human Development Index (HDI) is calculated on the basis of three different factors (education, life expectancy, and per capita GDP). Are these elements independent or is there, in fact, a causal interrelationship among them?
Think About It
What factors are used to calculate the Human Development Index, or HDI? What does each indicate about a population?
Are there any aspects of human development left out of the HDI? What other factors would you add to the index, if you were to make your own independent assessment of human development around the world?