Chapter 1. Area Graphs
Part A: Background
Carbon dioxide is one of the primary anthropogenic greenhouse gases that contribute to global warming.
This data set compares the contribution of four different countries to global carbon dioxide emissions.
Part B: Examine the Data Set
This is a set of climate data from the World Bank Database. This data represents carbon dioxide emissions per capita. Per capita literally means “for each person.” This number was calculated by dividing the total carbon dioxide production in that country by its population.
| Year | 2005 | 2006 | 2007 | 2008 | 2009 |
|---|---|---|---|---|---|
| United States | 19.7 | 19.2 | 18.3 | 18.6 | 17.3 |
| China | 4.4 | 4.9 | 5.2 | 5.3 | 5.8 |
| India | 1.3 | 1.3 | 1.4 | 1.5 | 1.7 |
| Japan | 9.7 | 9.6 | 9.8 | 9.5 | 8.6 |
Question 1.1
xHtCSDzAiCEG26trm+3i9AiaNnBQgsoi5l0ItSLG7x1n+4uLNsHuoGqwqAUv7kV6YTEW63etyCMukGYgFUf10b4GU1tD3ytSyXYkdROvH+JufMxuJxPZgmBDBBHScjrYIA6q6G1QUCGue1JKhix+7eBMZCSVUNDAycY2XtvCp06UtF21waGbV40F0kDh44gb3rT35gOpdRGtEiHsaahNFfMp9QF65zX3UjUkBO8hdnQuo4u4oVV2GxB5lQiuGjQ6p1h+M3YYPXOKXxDcY2303Iwn+hIwUJK4BnPJT6RoL/SAbo+nd3X1CXoPMy95WaId7v6xRqxlhwuFGGGTa9yDQ8c9/zBpUwVfpSvseCpROrmHviUN6W1VjPdxpgyIycXD+JvN1DotLelSkwXuApQRYY4xP/D2TUDAJW3EhBtu38SgXYbSpyonLTdG0wwNu80jzY4vfU1KSozwjgVt4Dh1TtjXfwrvGyYcSZzBNkRaMGTroJWkdaSTosid9tknXncBNw5OHTXcaTtu3hj4aCDQpeAy49WDyEnzujiEaRUb3kl0UVai7G56itEl5VG89j0D4Te27C8vb7jSf+zixLgukzgEPQL0K3mMI28Olg==Question 1.2
mQoZRvaJouCiTdd+oL+/Kg2pzwJfWjOQ6BCC7AsqtSSwTcR/KZBRQi+4xLIujgxu1/ClztmHK89NKaCAVe4dMrK+hpKtvhyZJE9DBRm2jMaBweV5KlBV4vH+uD4svJRA5d+dHX3m3M62T+BXtB/TpNH4vZr4prcI6AwtD4SI6bGsdyjvXALsbhh/CGcyOuqwDgVov9826uE0ZnGnO+R+PEDtdNZVLMwWd89fefiO0o107J5yx6R9xP9azhrdRKEXLBb0Lqf9v5V6/w1xBG4wgXa6hXpfrDv5lwPBD22pMUTnExu2x50go3nVs4BFMwL+HTD+7hGNRSNWXb+qqcbHFR7UvMqA/tABvMdpowJoq3sXSuvPfqLC+aUg8O2Tvb0wg5otgNHJHxfZS+pJNu3tkskC4D6cRaQt4zq1QsT3Lvc9TZwdnigTxuM0TjM=Part C: Build the Graph
Instructions: Create a graph below. Begin by giving it a relevant title, such as "CO2 Emissions compared". Label the X axis as “Year”, and the the Y axis as "Per Capita CO2 Emissions (metric tons)".
Next, input the actual data into the graph. Each group of data (U.S, China, India, Japan) will be graphed as a line. Students must graph the line with the lowest overall numbers first, followed by the next lowest and so on. The area between each line will then be filled in to create the area graph.
| Year | 2005 | 2006 | 2007 | 2008 | 2009 |
|---|---|---|---|---|---|
| United States | 19.7 | 19.2 | 18.3 | 18.6 | 17.3 |
| China | 4.4 | 4.9 | 5.2 | 5.3 | 5.8 |
| India | 1.3 | 1.3 | 1.4 | 1.5 | 1.7 |
| Japan | 9.7 | 9.6 | 9.8 | 9.5 | 8.6 |

Question 1.3
y1o3yZndLwdv6X71U3X47iZSyBRhPG+mWo4nQFGCyJjUuw2Rp7oU2U0kX37TN3pWGfROOw4pUsONfCHtbNIKWEWdkOfCdTWwnq7UrxgrH8FYqEM2E3QM7lYCiojt81eILHUeXmjGSfCb0zwoR1zLkAdbMYWX35olvU2nTr6UoL/CbMr+42PwyXv0Rsvb72HGQhQXPxE7DOIDR74b1zErpsqrBmvXNmIbVld6ukSX5ESX7hS8NhE/zNn8x8HIYOpFrvmIzACvGl+EMN0xKP6EatFxoq+4MwhoHAIKLkoH4OyFiR01+/sZQv+nLvh6B4qUEqvZnw==Part D: Apply Skills
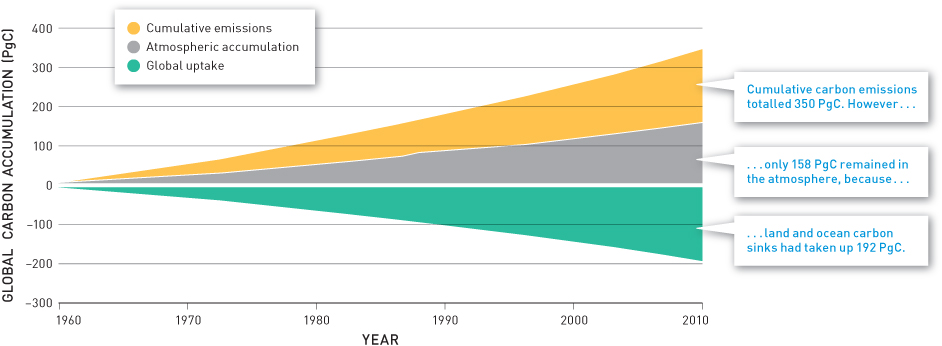
This area graph shows the uptake of carbon dioxide by land and oceans between 1960 and 2010.
Question 1.4
eQmV8E/Q+EAb48efboG6UcR4/D25TwkNtWBClU+nnT2Wb5gh4w3+YLYLciBZFJdSuHVEIhWDPYWDYbHAUwHWNLIEntSSmo+9ACah+SNQ6NWTc258eVWASJsvlpO+BJG6OkeVxbNEtViQXQtcpQiPJQguPqp67/HBEnTaOYJnWqR428e3tsRGHx+pqfO4oNo0sKDfvbKz4LLBfKkwYDjg2B3h/ArHG9l5GZYxQwBMDrsf6TfKzZnQ0P8k3L31NtCQCZOvzKd8LmORAfc9DIeCn4zWNETeS6pMnvpSbdezl0mnz0qbxHTDBDD1IaVlPD8ZzUyiH+Z3ZtbYWv9iw2GNC4W91w3TVjAUq/OtXjEZogq862198rf5YywqXa7hinKdiOQn2h/ElGAcX04r3JxO21OGj/PqPA5KsJlyoksU+6sw9SEFkIIXYQ==Question 1.5
H4Vm0miT3BlTpiqe5otZQX2T2YlrJDdXOhwfsCx8zGjlf4ig57kqV6j2O0zycWwP2kR8Fa9cFvdRG/ZM+OG1HT5D8fesNRVbbI651Mg3EfO4PMxBGds279vMj2v64YsCo1w0LNI+zktGB2J96RPacRLd9PrKjF3HGN3eRluEeEJ29yjimxBu7jBRZ4W81ADUHIj7ngjAEcdm315KAR5uZ8Yl5osAM4H17Lv1TObkHVDi0WDTOXQdxTtFFF3EkGeb1LFcV9swSB/NdpiyO2jzfRDKRvo0DT0J0uCu/7oPoInCZ3YHlpjQI1IyUumORN/6WCbYza68tI/a+EamQEik7vBJWGznc9Q4yUPUzTV9UECbhnkNsy/WpFdewkQ5pJ5FndXd/hHA2LeqtsDVcT8zoX1v5N/AMc0XmyB+qRLCTYNB0dobg+7RNStlIwjNS/yazm02WUBfwkZxbMEJE7W1XBPnmES1NBqa1Eaon6E70YDgWqscp2f3tucqPWo=Question 1.6
NJD7Pc77PM2rw9JPq61Z9bMDJerY2pjOGJxsFDQW4Rms+BkiOyGLI6c8HKmRKdJGz1mFsJka4oUdtyVNo7qAEG0f0RQsu5EobuO6xEoGSSPMvIicaYvZQ8ydpoipDetKkQy+cuur2D+d8DjzE9pe75CFLfx4hxWfsT3gBf+s1tvi4fPktv0l/nhiY9p6FoSw8EjO7ITMcrhddt++v49Hn+bZ+DxbSp7YTsu601tOIu31AZqI6EQi/FK+Kr/czpQBBRvLD8lQcqD1m91/ghBsfLj5Fflr0LZ7u5oxmlhCLXXe4Hsm7ou0kw==1.1 Activity Completed!
Activity results are being submitted...