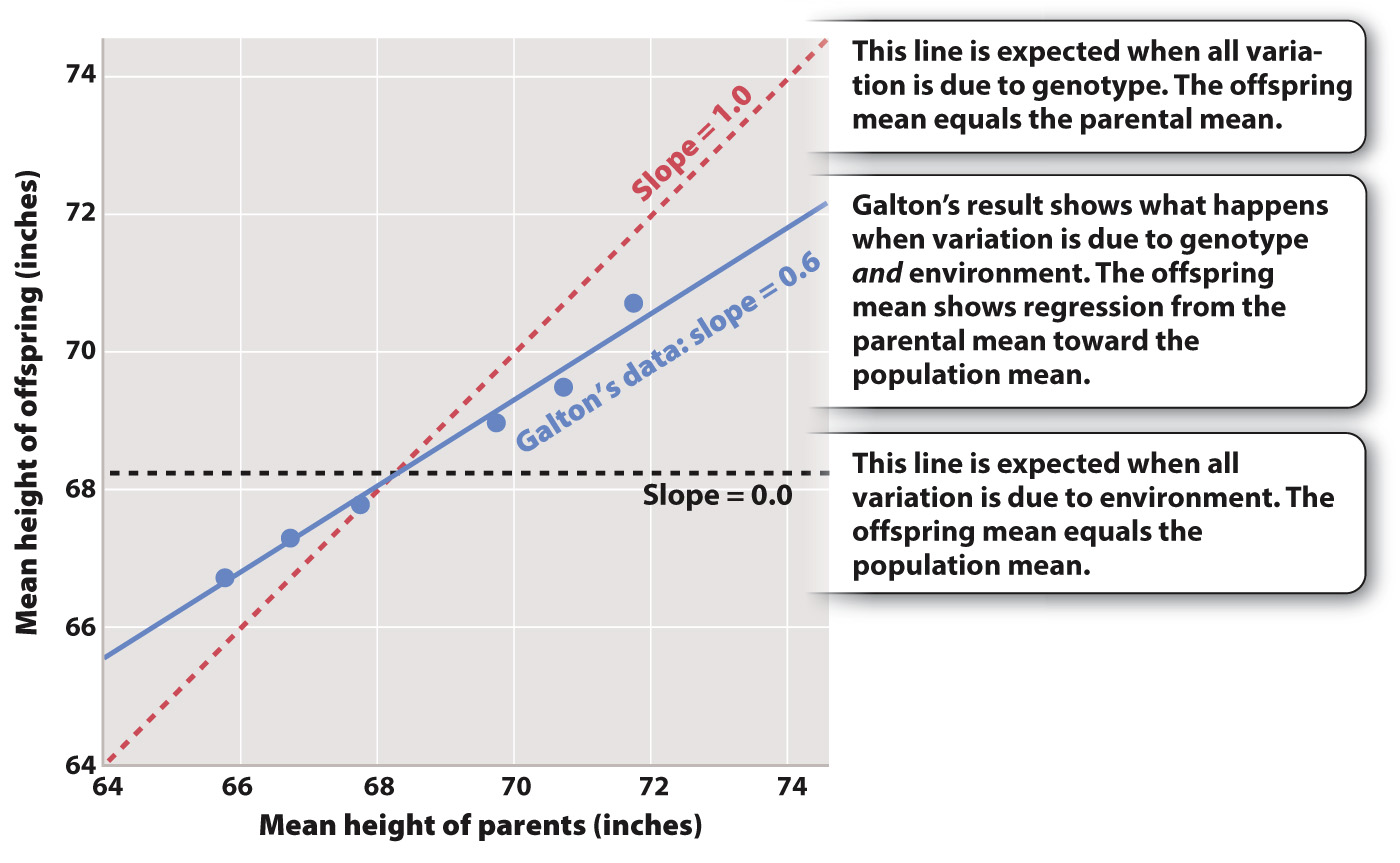
FIG. 18.8 Regression toward the mean. Galton’s data on the average adult height of parents and that of their offspring show that offspring mean height (blue line) falls between the parental mean (dashed red line) and the population mean (dashed black line).