HOW DO WE KNOW?
FIG. 21.4
How is genetic variation measured?
BACKGROUND The introduction of protein gel electrophoresis in 1966 gave researchers the opportunity to identify differences in amino acid sequence in proteins both among individuals and, in the case of heterozygotes, within individuals. Proteins with different amino acid sequences run at different rates through a gel in an electric field. Often, a single amino acid difference is enough to affect the mobility of a protein in a gel.
METHOD Starting with crude tissue—
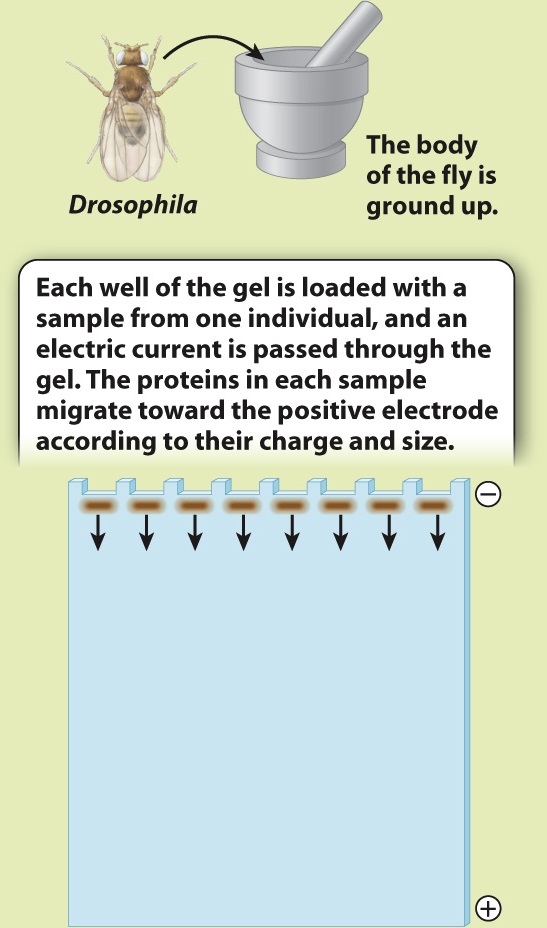
RESULTS The Adh gene has two common alleles, distinguished by a single amino acid difference that changes the charge of the protein. One allele, Fast (F), accordingly runs faster than the other, Slow (S). Four individuals are S homozygotes; two are F homozygotes; and two are FS heterozygotes. Note that the heterozygotes do not stain as strongly on the gel because each band has half the intensity of the single band in the homozygote. We can measure the allele frequencies simply by counting the alleles. Each homozygote has two of the same allele, and each heterozygote has one of each.
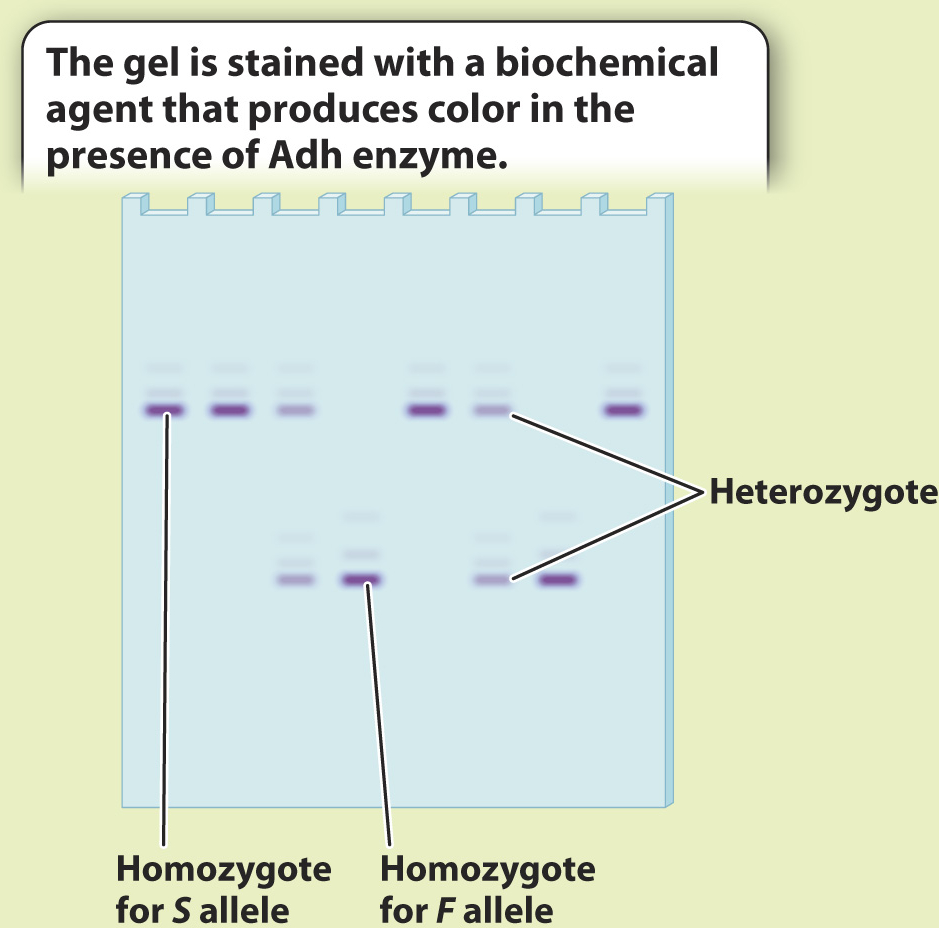
Total number of alleles in the population of 8 individuals = 8 × 2 = 16
Number of S in the population = 2 × (number of S homozygotes) + (number of heterozygotes) = 8 + 2 = 10
Frequency of
Number of F in the population = 2 × (number of F homozygotes) + (number of heterozygotes) = 4 + 2 = 6
Frequency of
Note that the two allele frequencies add to 1.
CONCLUSION We now have a profile of genetic variation at this gene for these individuals. Population genetics involves comparing data such as these with data collected from other populations to determine the forces shaping patterns of genetic variation.
FOLLOW-
SOURCE Lewontin, R. C., and J. L. Hubby. 1966. “A Molecular Approach to the Study of Genic Heterozygosity in Natural Populations. II. Amount of Variation and Degree of Heterozygosity in Natural Populations of Drosophila pseudoobscura.” Genetics 54:595–