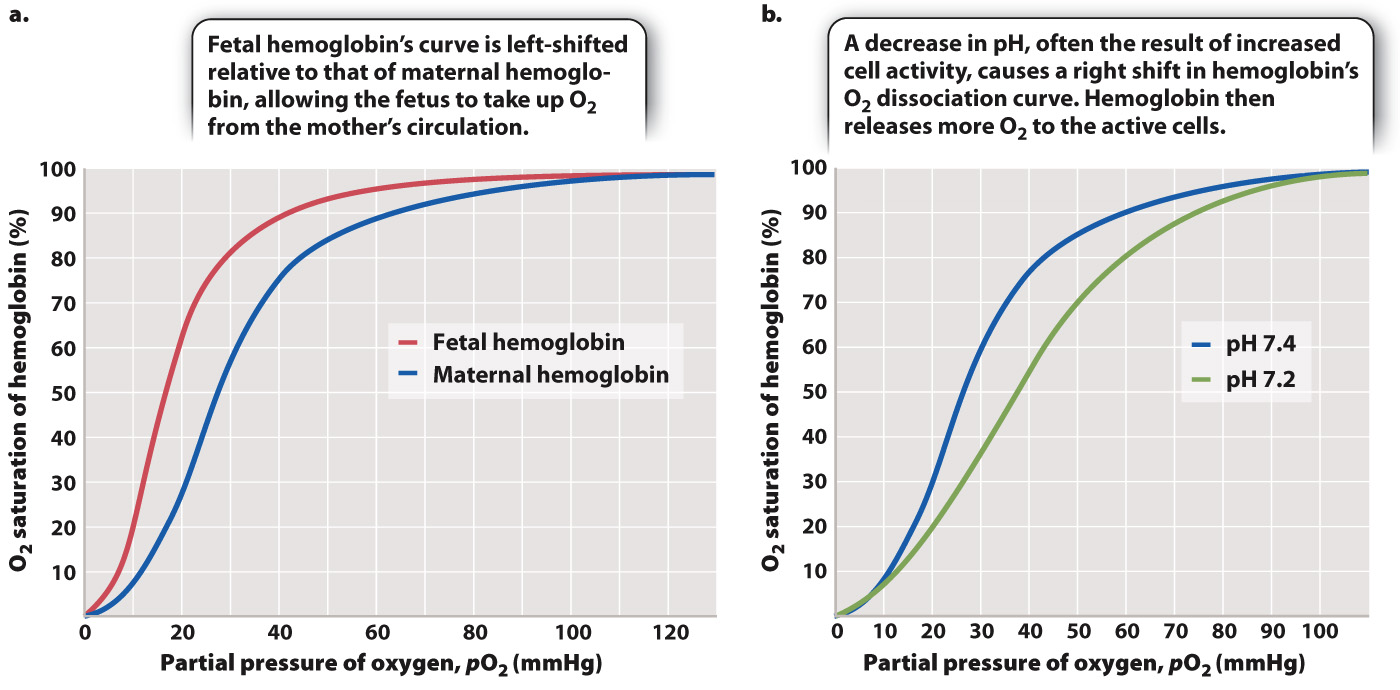
FIG. 39.15
Changes in hemoglobin’s O
2
dissociation curve.