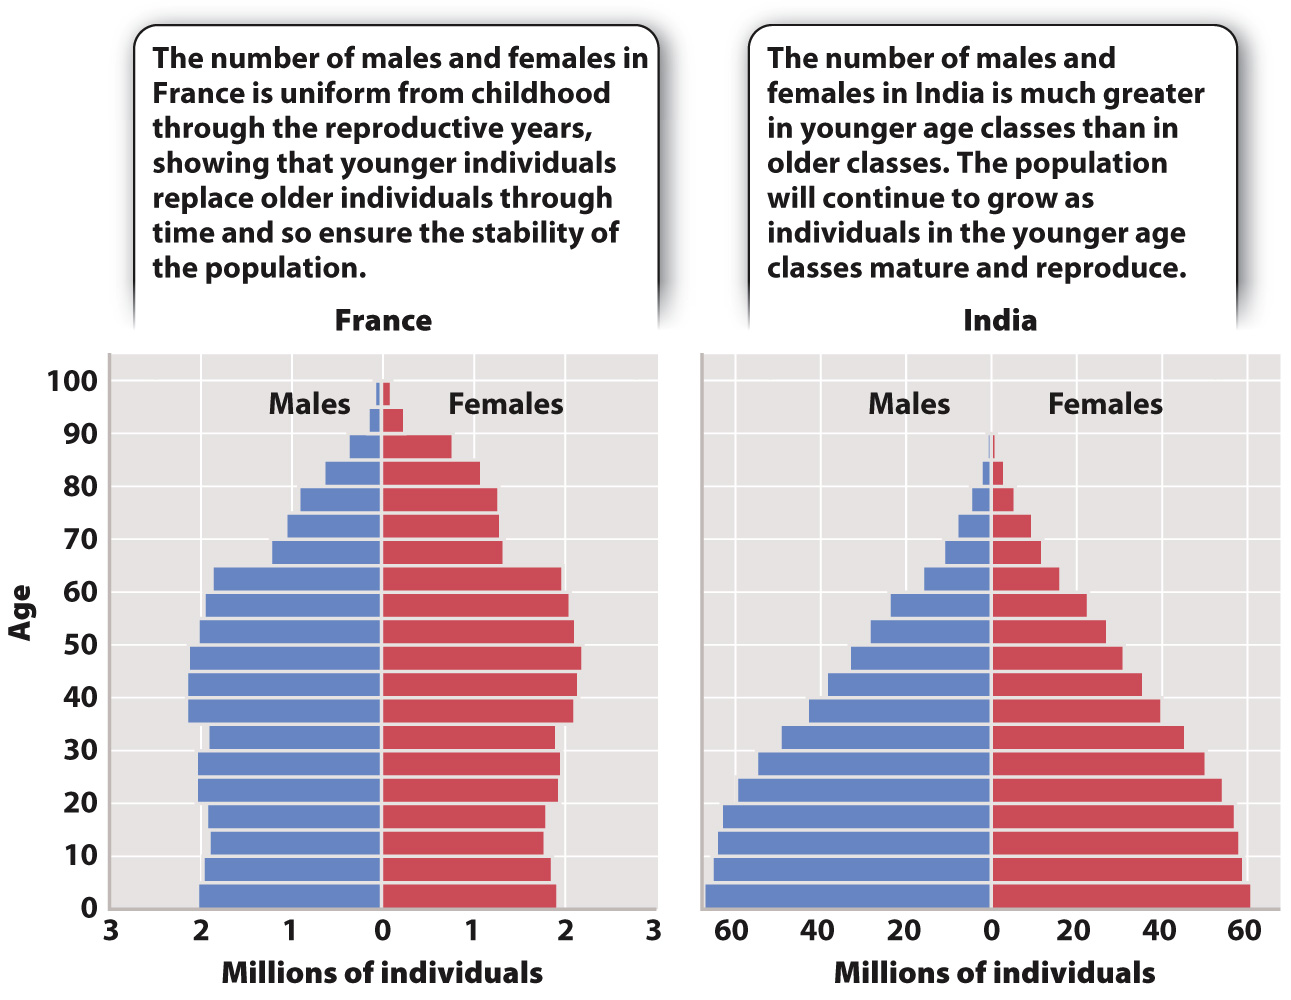
FIG. 46.8 Age structure of two populations, with data from 2010. The data are depicted as histograms, bar graphs in which the length of each bar indicates the number of individuals in the group (here, age group). Source: Data from United Nations Department of Economic and Social Affairs, Population Pyramids (France and India), http://esa.un.org/wpp/populationpyramids/population-