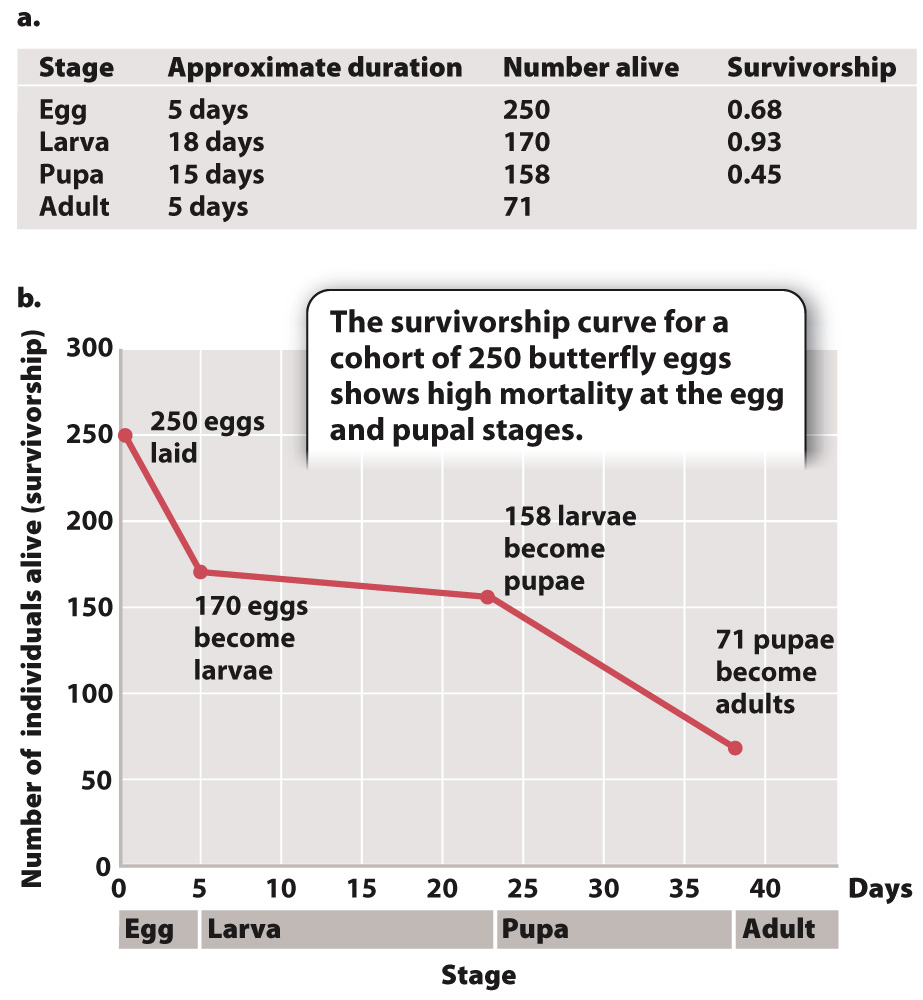
FIG. 46.11 Life table and survivorship curve. (a) A life table summarizes the number of individuals alive in each cohort of a population and can be represented graphically by (b) a survivorship curve, which plots the proportion of the original cohort alive at the end of each stage or time period. Source: Data from M. Pathak, and P. Q. Rivsi, 2002, “Age Specific Life Tables of Papilio demoleus on Different Hosts,” Annals of Plant Protection Sciences 10(2):375–