Genetic mapping assigns a location to each gene along a chromosome.
With the exception of a few regions, such as the area near the centromere, the likelihood of a crossover occurring somewhere between two points on a chromosome is approximately proportional to the length of the interval between the points. Therefore, the frequency of recombination can be used as a measure of the physical distance between genes. These distances are used in the construction of a genetic map, which is a diagram showing the relative position of genes along a chromosome. The maps are drawn using a scale in which one unit of distance (called a map unit) is the distance between genes resulting in 1% recombination. Thus, in a Drosophila genetic map containing the genes w and cv, the distance between the genes is 12.2 map units.
356
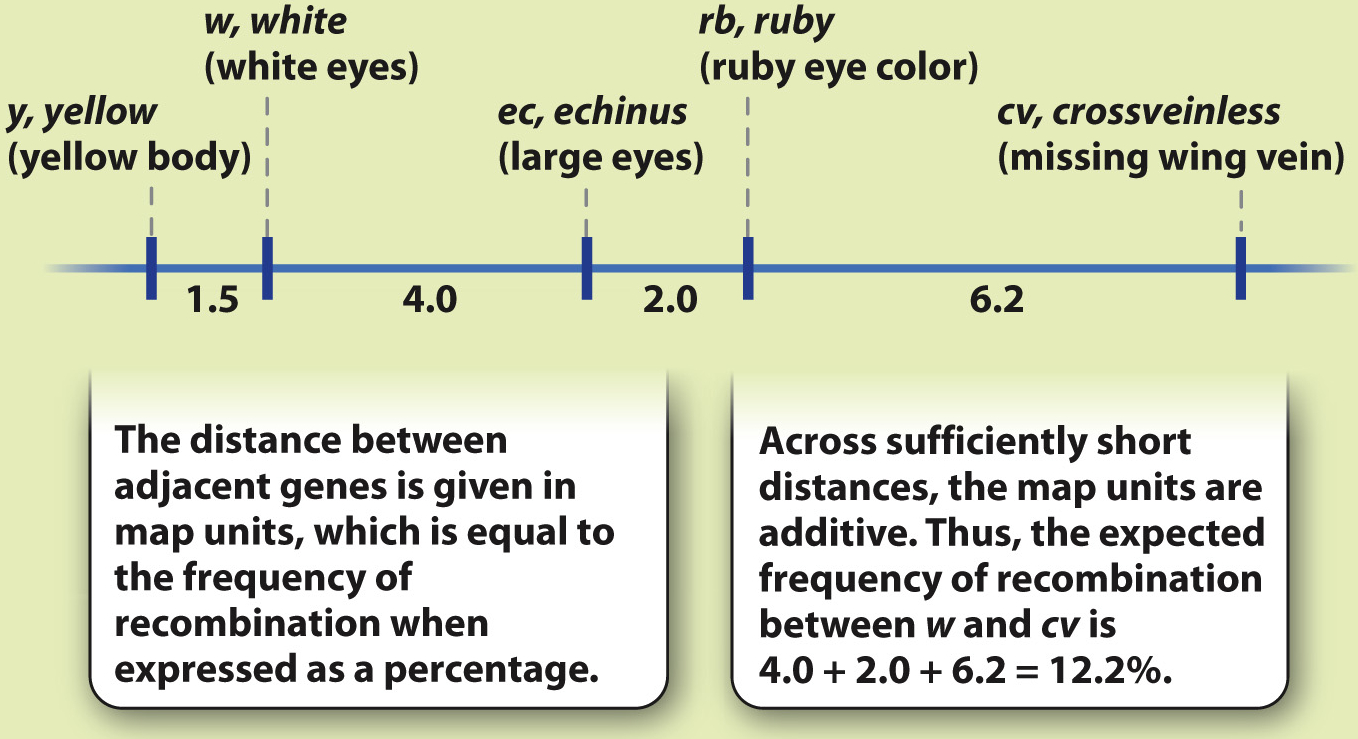
Genetic maps are built up step by step as new genes are discovered that are genetically linked, as shown in Fig. 17.11. Across distances that are less than about 15 map units, the map distances are approximately additive, which means that the distances between adjacent genes can be added to get the distance between the genes at the ends. For example, in Fig. 17.11, there are two genes between w and cv. The map distance between w and the next gene, ec, is 4.0, the distance between ec and the next gene, rb, is 2.0, and the distance between rb and cv is 6.2. The map distance between w and cv is therefore 4.0 + 2.0 + 6.2 = 12.2 map units, and hence the expected frequency of recombination between these genes is 12.2%, which is the value observed.
HOW DO WE KNOW?
FIG. 17.11
Can recombination be used to construct a genetic map of a chromosome?
BACKGROUND In 1910, Thomas Hunt Morgan discovered X-
HYPHOTHESIS Sturtevant hypothesized that recombination was due to crossing over between the genes, and that genes farther apart in the chromosome would show more recombination.

EXPERIMENT Taking this idea a step further, Sturtevant reasoned that if one knew the frequency of recombination between genes a and b, between b and c, and between a and c, then one should be able to deduce the order of genes along the chromosome. He also predicted that, if the order of genes were known to be a–
RESULTS Sturtevant studied the frequencies of recombination between many pairs of genes along the X chromosome, including some of those shown in the illustration shown here.
CONCLUSION The results confirmed Sturtevant’s hypothesis and showed that genes could be arranged in the form of a genetic map, depicting their linear order along the chromosome, with the distance between any pair of genes proportional to the frequency of recombination between them. Across sufficiently short regions, the frequencies of recombination are additive.
FOLLOW-
SOURCE Sturtevant, A. H. 1913. “The Linear Arrangement of Six Sex-
However, for two genes that are farther apart than about 15 map units, the observed recombination frequency is somewhat smaller than the sum of the map distances between the genes. The reason is that, with greater distances, two or more crossovers between the genes may occur in the same chromosome, and thus an exchange produced by one crossover may be reversed by another crossover farther along the way.
Quick Check 3 For two genes that show independent assortment, what is the frequency of recombination?
Quick Check 3 Answer
Independent assortment means that a doubly heterozygous genotype like AB ab produces gametes in the ratio ¼ AB: ¼ Ab: ¼ aB: ¼ ab. The first and last are nonrecombinant gametes, and the second and third are recombinant gametes. The frequency of recombination is therefore ¼ + ¼ = ½, or 50%. This means that independent assortment is observed for genes that are far apart in the same chromosome as well as for genes in different chromosomes.