The simplest tree is often favored among multiple possible trees.
To show how synapomorphies help us chart out evolutionary relationships, let’s consider the simple example in Fig. 23.8. We begin with four species of animals (labeled “A” through “D”) in a group we wish to study that we will call our ingroup; we believe the species to be closely related to each other. For comparison, we have a species that we believe is outside this ingroup—
We are interested in the relationships among species A–
470
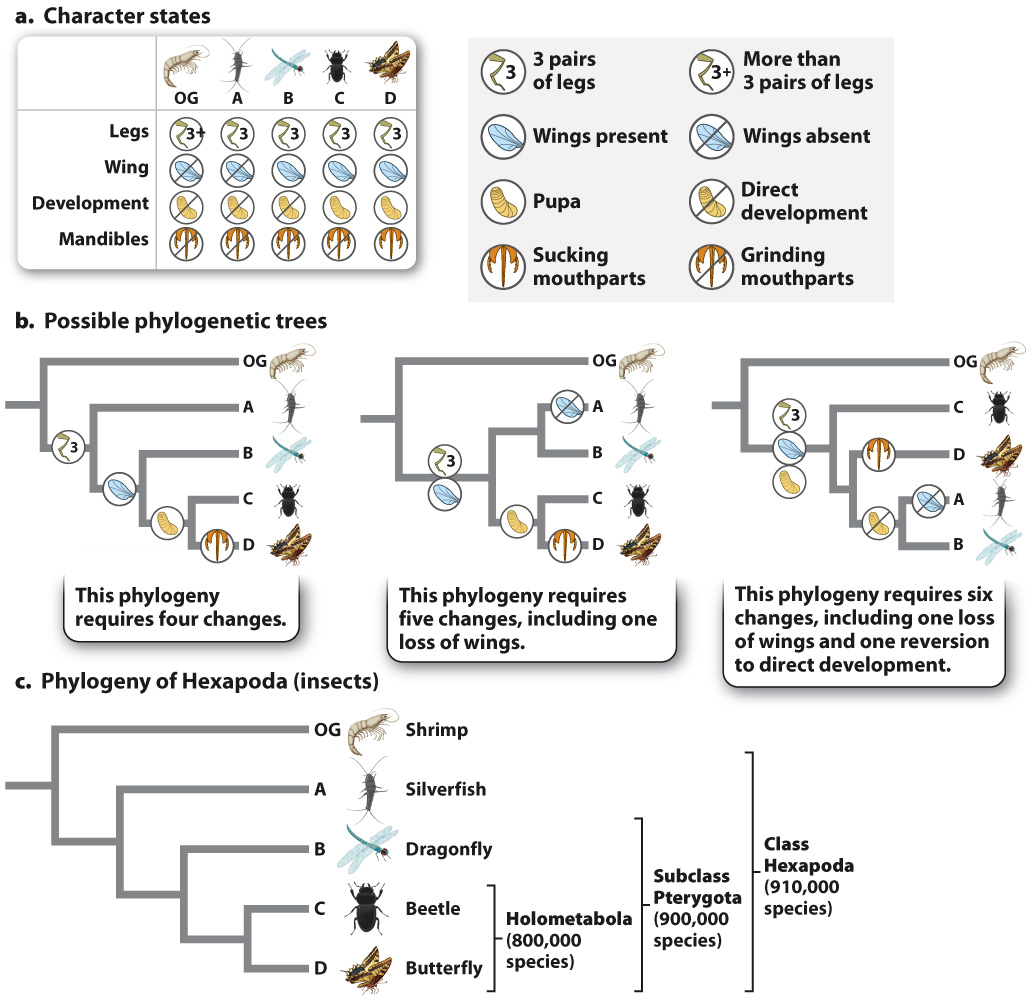
How do we choose among the alternatives? Studies of the outgroup show that it does not form pupae, supporting the hypothesis that pupal development evolved within the ingroup. In practice, biologists examine multiple characters and choose the phylogenetic hypothesis that best fits all of the data.
How do we determine “best fit”? Fig. 23.8b illustrates three different hypotheses for the relationships among the species based on four characters and their various character states. Each reflects the sister-
471
Now consider the middle tree in Fig. 23.8b. It groups A and B together, and so differs from the tree on the left in requiring either a loss of wings in A, or an additional origin of wings in B, independent of that in the common ancestor of C and D—
In general, trees with fewer character changes are preferred to ones that require more because they provide the simplest explanation of the data. This approach is an example of parsimony, that is, choosing the simpler of two or more hypotheses to account for a given set of observations. When we use parsimony in phylogenetic reconstruction, we make the implicit assumption that evolutionary change is typically rare. Over time, most features of organisms stay the same—
In systematics, parsimony suggests counting character changes on a phylogenetic tree to find the simplest tree for the data (the one with the fewest number of changes). Each change corresponds to a mutation (or mutations) in an ancestral species, and the more changes or steps we propose, the more independent mutations we must also hypothesize.
Note also that it isn’t necessary to make decisions in advance about which characters are homologies and which are analogies. We can construct all possible trees and then choose the one requiring the fewest evolutionary changes. This is a simple matter for the example in Fig. 23.8 because four species can be arranged into only 15 possible different trees. As the number of groups increases, however, the number of possible trees connecting them increases as well, and dramatically so. There are 105 trees for 5 groups and 945 trees for 6 groups, and there are nearly 2 million possible trees for 10. For 50 groups the possibilities balloon to 3 × 1076! Clearly, computers are required to sort through all the possibilities.
As is true for all hypotheses, phylogenetic hypotheses can be supported strongly or weakly. Biologists use statistical methods to evaluate a given phylogenetic hypothesis. Available character data may not strongly favor any hypothesis. When support for a specific branching pattern is weak, biologists commonly depict the relationships as unresolved and show multiple groups diverging from one node, rather than just two. Such branching patterns are not meant to suggest that multiple species diverged simultaneously, but rather to indicate that we lack the data to choose unequivocally among several different hypotheses of relationship. In Part 2, we show unresolved branches in a number of groups. These shouldn’t be read as admissions of defeat, but instead as problems awaiting resolution and opportunities for future research.