Records of atmospheric composition over 400,000 years show periodic shifts in CO2 content.

Earlier in this chapter, we discussed evidence that before the Industrial Revolution, atmospheric CO2 levels had not changed appreciably for 1000 years or more. Longer-term records, however, show that the CO2 levels in air can change substantially through time.

518

At Vostok, high on the Antarctic ice sheet, glacial ice records more than 400,000 years of environmental history (Fig. 25.9). As shown in the top graph of Fig. 25.9, the youngest samples show about 285 ppm CO2 in the atmosphere, consistent with direct measurements of air, including the first years of the Keeling curve. Notice, however, that 20,000 years ago, CO2 levels were much lower—about 180 ppm. In fact, the Vostok ice core in its entirety shows that atmospheric CO2 has oscillated between 285 ppm and 180 ppm for at least 400,000 years. On long timescales, therefore, the natural variations in the carbon cycle can be large.

image
FIG. 25.9 Atmospheric CO2 content for the past 400,000 years. These measurements were recorded from air bubbles trapped in glacial ice at Vostok, Antarctica. Source: Data from P. Rekacewicz, “Temperature and CO2 Concentration in the Atmosphere over the Past 400,000 Years,” from Vital Climate Graphics, UNEP/GRID–Arendal MAPs & Graphics Library, JPG file, 2005, http://www.grida.no/publications/vg/climate/page/3057.aspx. Based on J. R. Petit et al., 1999, “Climate and Atmospheric History of the Past 420,000 Years from the Vostok Ice Core, Antarctica,” Nature 399:429–436.

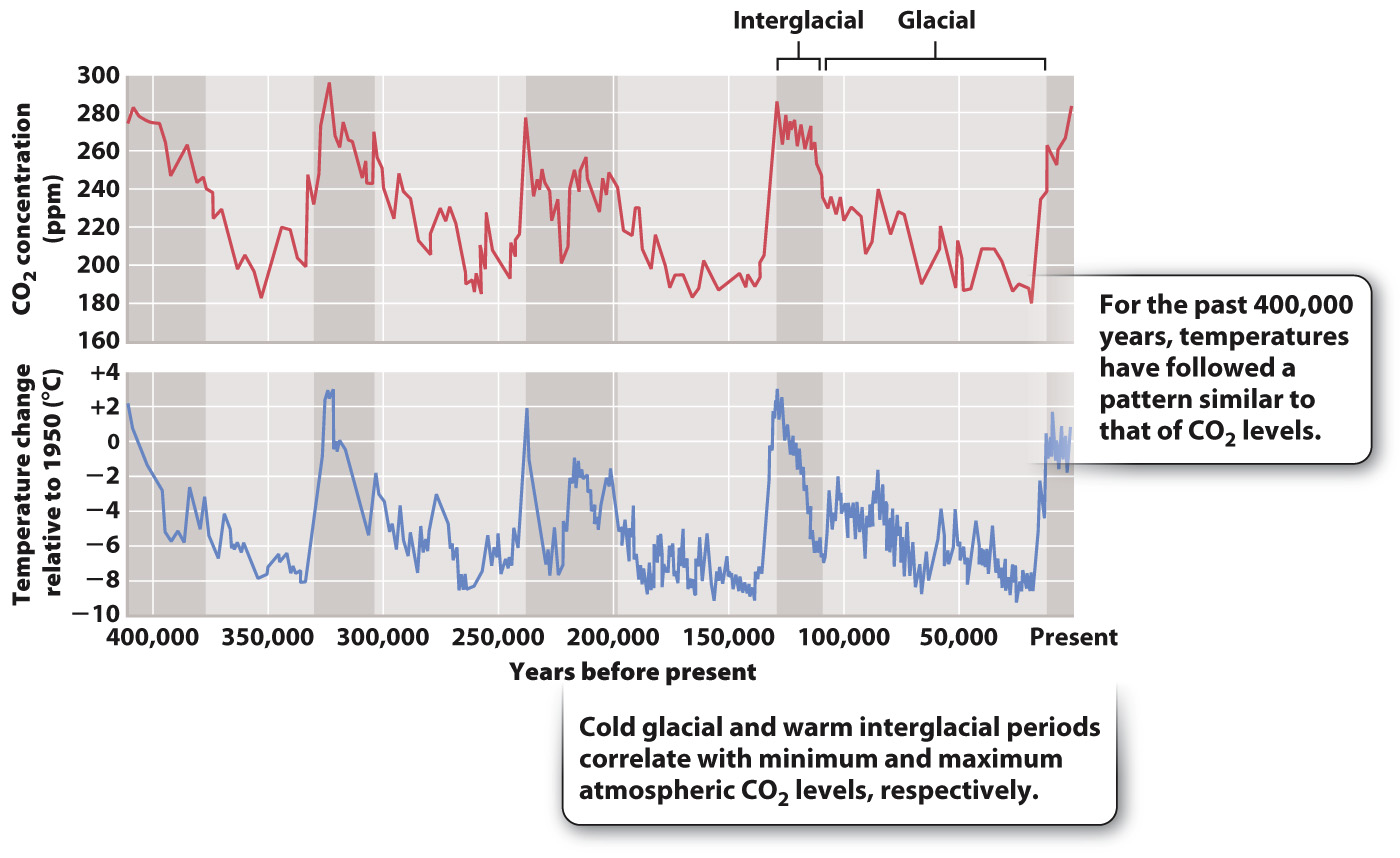
The bottom graph in Fig. 25.9 shows an estimate of surface temperature obtained by chemical analysis of oxygen isotopes in ice from the same glacier and how it differed from the average temperature in 1950. Over the last 400,000 years, Antarctic temperature has oscillated between peaks of a few degrees warmer than today and temperatures as much as 6°C to 8ºC colder than the present. Interestingly, the temperature and CO2 curves closely parallel each other. As discussed more fully in Chapter 49, CO2 is known to be an effective greenhouse gas, meaning that it allows incoming solar radiation to reach Earth’s surface but traps heat that is re-emitted from land and sea. Higher concentrations of CO2 result in warmer temperatures. Therefore, it is not surprising that climate and atmospheric CO2 levels show the parallel history documented in the figure.

519

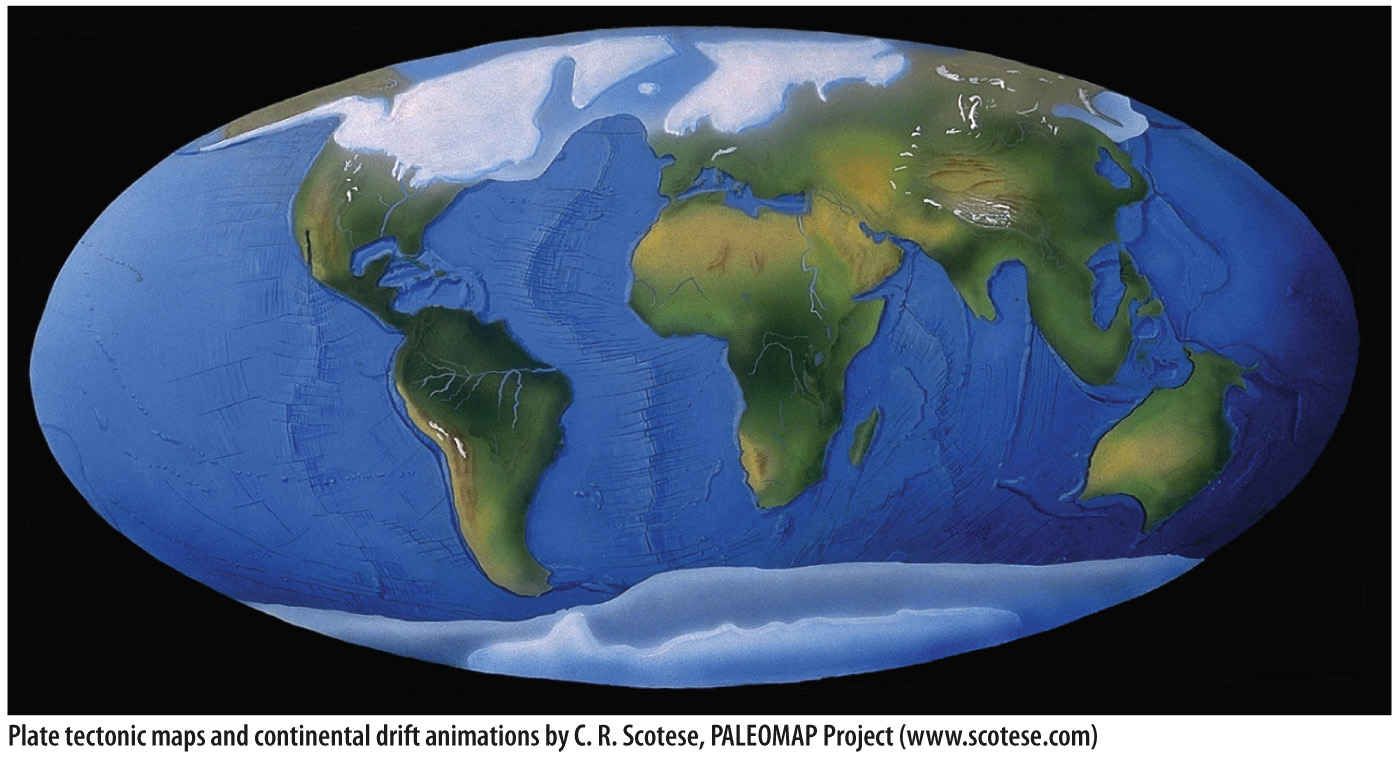
The two curves correlate closely with one further phenomenon, the periodic growth and decay of continental ice sheets. Large glaciers expanded in the Northern and Southern hemispheres a few million years ago, ushering in an ice age. Today, we live in an interglacial interval, when climate is relatively mild, but 20,000 years ago thick sheets of ice extended far enough away from the poles to cover the present site of Boston (Fig. 25.10). The repeated climatic shifts recorded in ice cores reflect periodic variations in the amount and distribution of solar radiation on Earth’s surface, which are caused by oscillating changes in Earth’s orbit around the sun.

image
FIG. 25.10 Earth’s most recent ice age. Twenty thousand years ago, glacial ice (shown in white) covered much of North America and Europe, as well as mountain ranges such as the Andes and Himalayas. Sea ice (light blue) expanded markedly in both northern and southern oceans.

520

The temperature and CO2 increases recorded by Vostok ice between 20,000 and 10,000 years ago coincide with the last great retreat of continental ice sheets. What processes might explain how atmospheric CO2 could increase by 100 ppm in just a few thousand years, as glaciers began to retreat? Can the short-term carbon cycle processes of photosynthesis and respiration account for this much carbon? Certainly, the amount of forests on Earth’s surface has varied through the past 500,000 years as ice sheets grew and decayed, but forests expand as glaciers shrink, so changes in forests cannot account for a pattern of increasing atmospheric CO2 with the retreat of glaciers. Volcanism and weathering also fail to account for the observed pattern. There is no evidence that volcanic activity has waxed and waned in a pattern that could explain observed CO2 variations. And rates of weathering, which remove CO2 from the atmosphere, should increase as temperature rises, but CO2 levels have actually increased. Something else must be going on.

Scientists continue to debate why atmospheric CO2 oscillates in parallel with glacial expansion and retreat, but, increasingly, proposed mechanisms suggest interactions involving the ocean and its large reservoir of inorganic carbon. For example, it has been hypothesized that during glacial advances, the circulation of carbon-rich deep-ocean waters back to the sea surface slows, causing more inorganic carbon to accumulate in the deep sea. With glacial retreat, the oceans circulate more vigorously, returning CO2 to the surface and then to the atmosphere. Whatever the explanation, the historical record of the past 400,000 years shows that climate can and does change without any input from humans, something we must take into account when considering our climatic future (Chapter 49).