Chapter 25 Summary
524
Core Concepts Summary
25.1 Photosynthesis and respiration are the key biochemical pathways of the biological, or short-
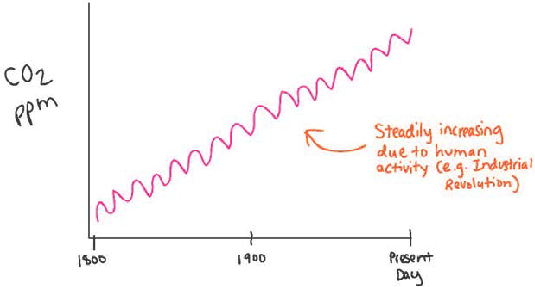
Keeling’s program to monitor CO2 levels in the atmosphere revealed two patterns: (1) CO2 levels oscillate on a yearly basis, and (2) CO2 levels have increased steadily to the present day since measurements began. page 510
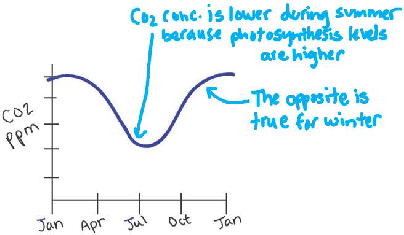
The first pattern (seasonal oscillation) can be explained by the global imbalance between photosynthesis and respiration in the summer and in the winter months. page 512
The second pattern (steady increase) can be extended further back in time by measuring the composition of air trapped in gas bubbles within polar ice. These measurements indicate that CO2 levels in the atmosphere remained steady for more than a thousand years, but then started to increase in the mid-
The ratio of different isotopes of carbon in the atmosphere indicates that most of the carbon added to the atmosphere in recent decades comes from human activities, particularly the burning of fossil fuels. page 513
25.2 Physical processes govern the long-
Physical processes, which act at slower rates and over longer timescales, are the major drivers of the long-
In following carbon around its cycle, it is important to consider where carbon is stored (reservoirs) and rates at which it is added to or removed from these stores (fluxes). page 515
Important reservoirs of carbon include organisms, the atmosphere, soils, the oceans, and sedimentary rocks. Sedimentary rocks are by far the largest carbon reservoir. page 515
Physical processes that remove CO2 from the atmosphere include the weathering of rocks, and those that add CO2 to the atmosphere include volcanoes and the oxidation of ancient organic matter in sedimentary rocks. page 516
The short-
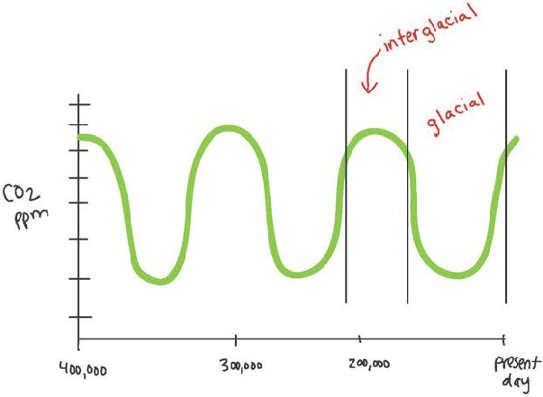
Over the last 400,000 years, CO2 levels in the atmosphere have gone through periodic shifts that coincide with repeated cycles of glaciation. page 518
CO2 levels in the atmosphere 500 million years ago may have been as much as 15 to 20 times higher than present-
Over time spans of hundreds of millions of years, movements of Earth’s plates become major influences on the carbon cycle. page 520
25.3 The carbon cycle can help us understand ecological interactions and the evolution of biological diversity.
Photosynthetic and other autotrophic organisms are primary producers, converting CO2 into organic molecules. page 521
Heterotrophic organisms that eat primary producers are called primary consumers. page 521
Heterotrophs that prey on grazers are called secondary consumers. page 521
Interacting networks of species, linked by predator–
Primary producers are well adapted to obtaining sunlight, water, and nutrients in different environments. page 522
Primary and secondary consumers are adapted to obtaining different sources and sizes of food. page 522
The evolution of life on Earth can be considered a long history during which organisms have evolved different ways of obtaining energy and carbon from their environment. page 523
The interactions between biological and geologic processes at work in the carbon cycle are also responsible for Earth’s oxygen-
Self-Assessment
Why does the coupling of photosynthesis and respiration result in the cycling of carbon?
Self-Assessment 1 Answer
In photosynthesis, light drives the reaction of CO2 and water to form organic matter (sugar) and oxygen gas; in respiration, just the opposite occurs, cycling organic carbon back to CO2.
Draw and explain the curve representing changing atmospheric levels of CO2 over the course of a year.
Self-Assessment 2 Answer
This curve represents changing atmospheric levels of CO2 over the course of a year. CO2 levels oscillate with the seasons for two reasons. First, rates of photosynthesis (which removes CO2 from the atmosphere) are higher in summer months, whereas respiration (which returns CO2 to the atmosphere) continues throughout the year. Second, there is more land in the Northern Hemisphere, and so global trends through the year are dominated by Northern Hemisphere organisms.
Draw and explain the curve representing changing atmospheric levels of CO2 over the past 150 years.
Self-Assessment 3 Answer
This curve represents changing atmospheric levels of CO2 over the past 150 years. It shows a steady increase in levels of CO2, mainly due to human activities such as the burning of fossil fuels.
Describe one way by which the source of the modern increase in CO2 in the atmosphere can be determined.
Self-Assessment 4 Answer
One way in which the source of increase in CO2 in the atmosphere can be determined is through the measurement and tracking of carbon isotopes. The various candidate sources of increasing CO2—volcanic gases, inorganic carbon dissolved in the oceans, and organic carbon in living organisms and soil—
have different proportions of 12C, 13C, and 14C. By measuring the ratios of all three carbon isotopes year after year, scientists can draw hypotheses about the sources of CO2 added each year to the atmosphere. How do geologic processes participate in the long-
term carbon cycle? Self-Assessment 5 Answer
Geologic processes that influence the long-
term carbon cycle include volcanism; chemical weathering and mineral precipitation; plate tectonics; and the oxidation of coal, oil, and other forms of ancient organic matter. Volcanism injects CO2 into the atmosphere, as does the oxidation of ancient organic matter. Chemical weathering removes CO2 from the atmosphere. Plate tectonic processes build mountains, increasing rates of chemical weathering, but also govern the rate at which organic carbon is buried in sediments. Draw and explain the curve representing changing atmospheric levels of CO2 over the last 400,000 years.
Self-Assessment 6 Answer
This curve represents the changing atmospheric levels of CO2 over the past 400,000 years. It shows that CO2 levels in air have oscillated substantially through time. This oscillation in atmospheric CO2 correlates closely with oscillations in temperature and the extent of glacial ice. Sharp reductions in the level of CO2 are thought to reflect ocean circulation—
and, because of this, CO2 storage in deep oceans— during glacial intervals. The return of this CO2 to the atmosphere facilitates warming and the establishment of interglacial intervals.