Birth and death rates vary with age and environment.
To understand past and predict future changes in populations, ecologists use birth rates, expected longevity of individuals, and the proportion of individuals in a population that is able to reproduce. Insights into these parameters come from the age structure of a population, the number of individuals within each age group of the population studied. A population in which most individuals are past their age of greatest reproduction (because for some reason young are not surviving) or a population mostly composed of individuals that has not yet reached peak reproductive age (because older individuals are not surviving) will not increase as rapidly as one dominated by individuals capable of greatest reproductive output.
To reconstruct the age structure of a population, researchers commonly divide the population, or a sample of the population, into age classes, for example individuals born within a single year or within an interval of several years. Age can often be determined by measuring an aspect of the organism’s anatomy (for example, counting growth rings in fish scales or in a core drilled into a tree trunk) or estimated by overall size (for example, length of a fish or tree height).
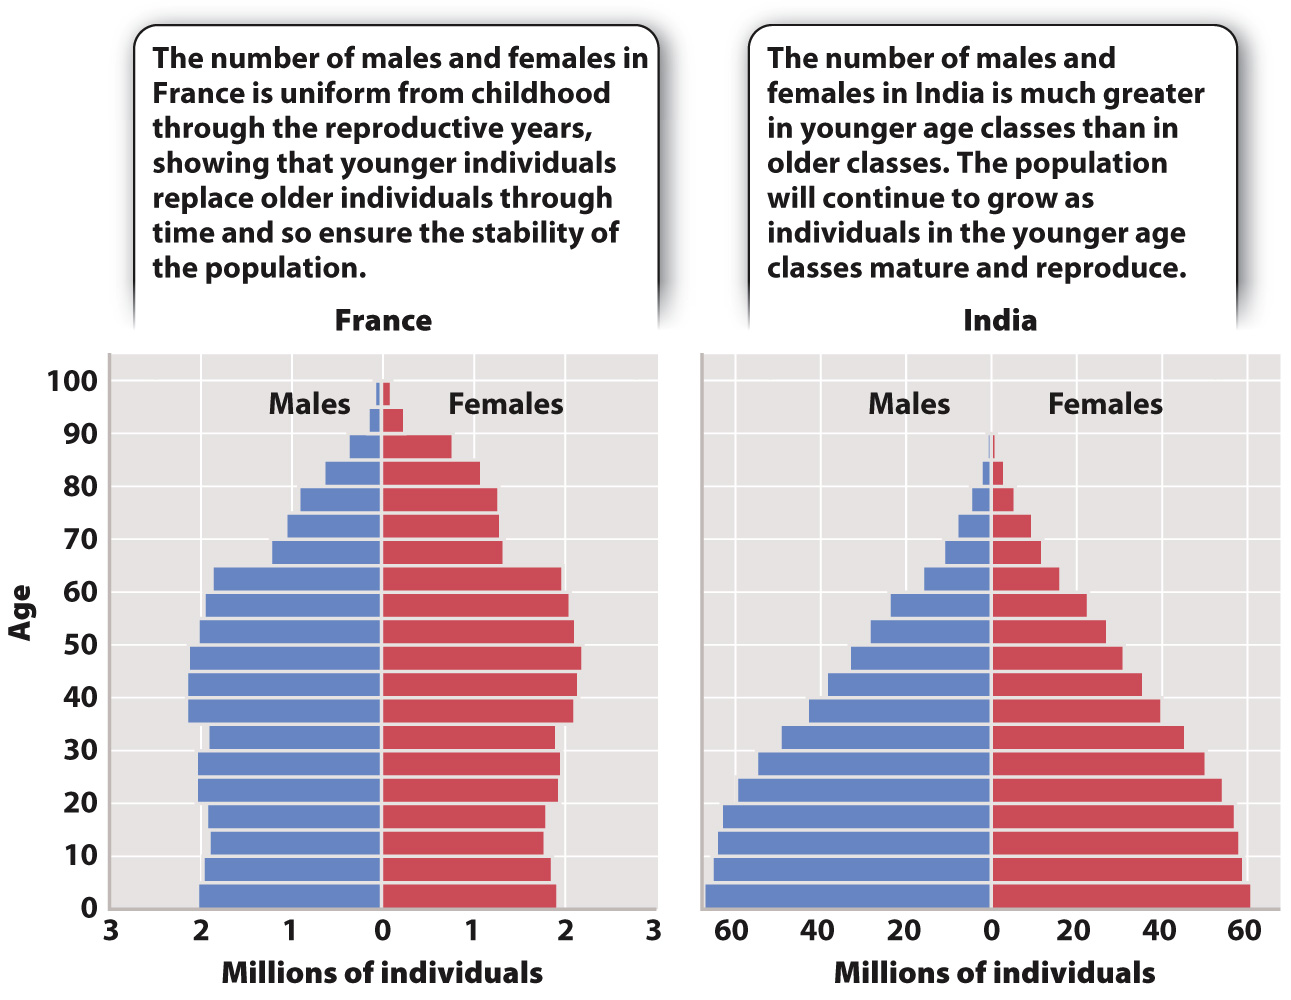
Estimating the number of individuals of differing ages enables ecologists to predict whether the size of a population will increase or decrease. A growing population usually shows a pyramid-
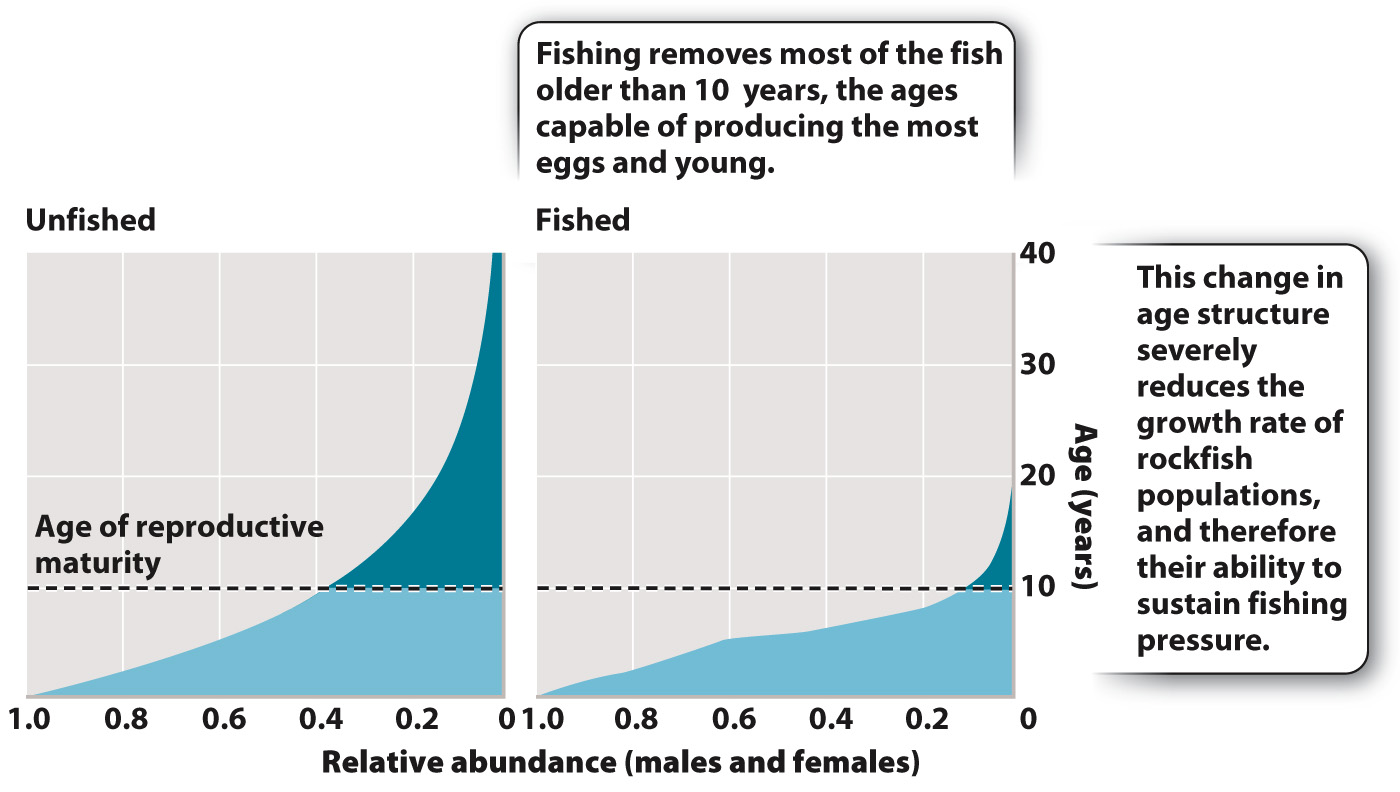
In humans, such differences reflect, in part, socioeconomic variation among countries, but differences in the age structure of other species can reveal threats from various sources. Fig. 46.9 shows the effects of overfishing on the age structure of a species of long-