Ecologists estimate population size by sampling.
Imagine trying to calculate the size of a population of Lime Swallowtails by counting every individual in the Dominican Republic. The task is hopeless. Like that of the Lime Swallowtail, the populations of most species are either too large or too widely dispersed for every individual to be counted. Instead, ecologists estimate population size by taking repeated samples of a population and from these samples estimating the total number of individuals. With an estimate of population size and range, ecologists can then determine population density.
For sessile, or sedentary, organisms like milkweeds in a field or barnacles on a rocky shoreline, ecologists commonly lay a rope across the area of interest and count every individual that touches it, or they throw a hoop and count the individuals inside it. Each such count gives one sample. They then take a number of samples and from them estimate the number and distribution of individuals in the population. For example, suppose 1-
1007
It is relatively easy to count sedentary organisms along a straight line or within a grid area, but many species move around. How do ecologists estimate population size for turtles in a pond, or mice in a forest? In these cases, a method called mark-
HOW DO WE KNOW?
FIG. 46.3
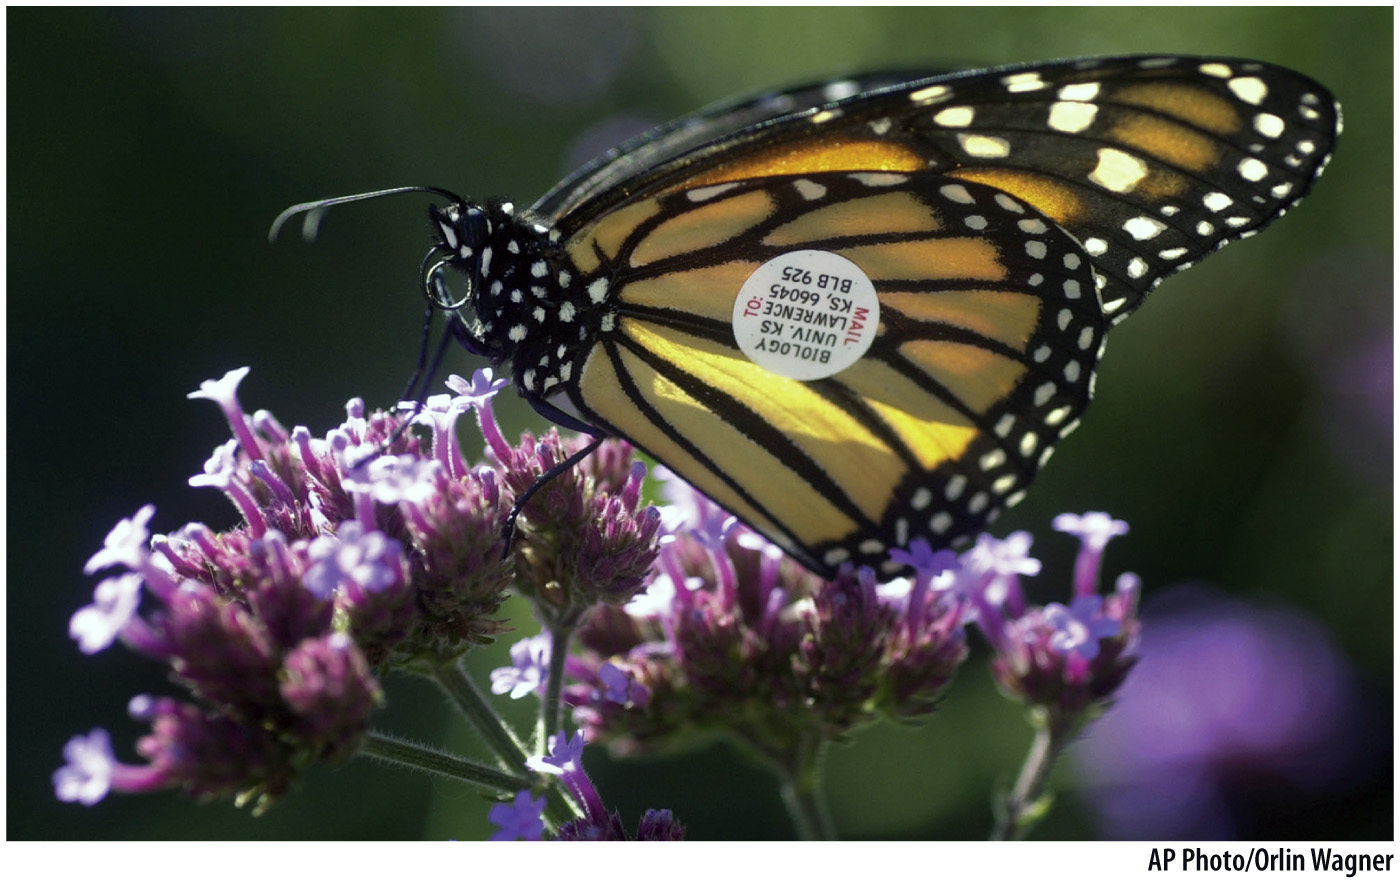
How many butterflies are there in a given population?
BACKGROUND Individuals in many populations of butterflies (and other animals) most often live and die within the patch of habitat where they were born. Population sizes of such animals can be estimated by a technique called mark-
METHOD Butterflies, such as the Monarch, are captured in an area, marked with an identification sticker on the wing as shown here, and then released. The number of marked butterflies is recorded. The next day, butterflies are caught and the number of marked and unmarked butterflies is recorded. Butterflies with marks are the recaptures.
To find the population size (N), we take the total number of marked butterflies and unmarked butterflies caught on the second day (C) and divide by the number of recaptures (R). We multiply this number by the number of butterflies marked on the first day (M), as follows:
N = (C/R) × M
RESULTS Let’s say we capture 100 butterflies on the first day, mark them, and release them. On the second day, we capture 120 butterflies, 30 of which are marked and the rest unmarked. We conclude that the population size is (120/30) × 100, or 400 butterflies total in the population sampled.
RELATED METHODS Mark-
SOURCE Lincoln, F. C. 1930. “Calculating Waterfowl Abundance on the Basis of Banding Returns.” Cir. U.S. Department of Agriculture 118:1–
These methods are simple, and they make a number of assumptions about the population. For example, we assume that the population has not changed in size between our first and second samples. Nonetheless, mark-