10.2 Assessing Intelligence
intelligence test a method for assessing an individual’s mental aptitudes and comparing them with those of others, using numerical scores.
10-
achievement test a test designed to assess what a person has learned.
An intelligence test assesses people’s mental abilities and compares them with others, using numerical scores. How do we design such tests, and what makes them credible? Consider why psychologists created tests of mental abilities and how they have used them.
aptitude test a test designed to predict a person’s future performance; aptitude is the capacity to learn.
By this point in your life, you’ve faced dozens of ability tests: school tests of basic reading and math skills, course exams, intelligence tests, driver’s license exams. Psychologists classify such tests as either achievement tests, intended to reflect what you have learned, or aptitude tests, intended to predict your ability to learn a new skill. Exams covering what you have learned in this course are achievement tests. A college entrance exam, which seeks to predict your ability to do college work, is an aptitude test—
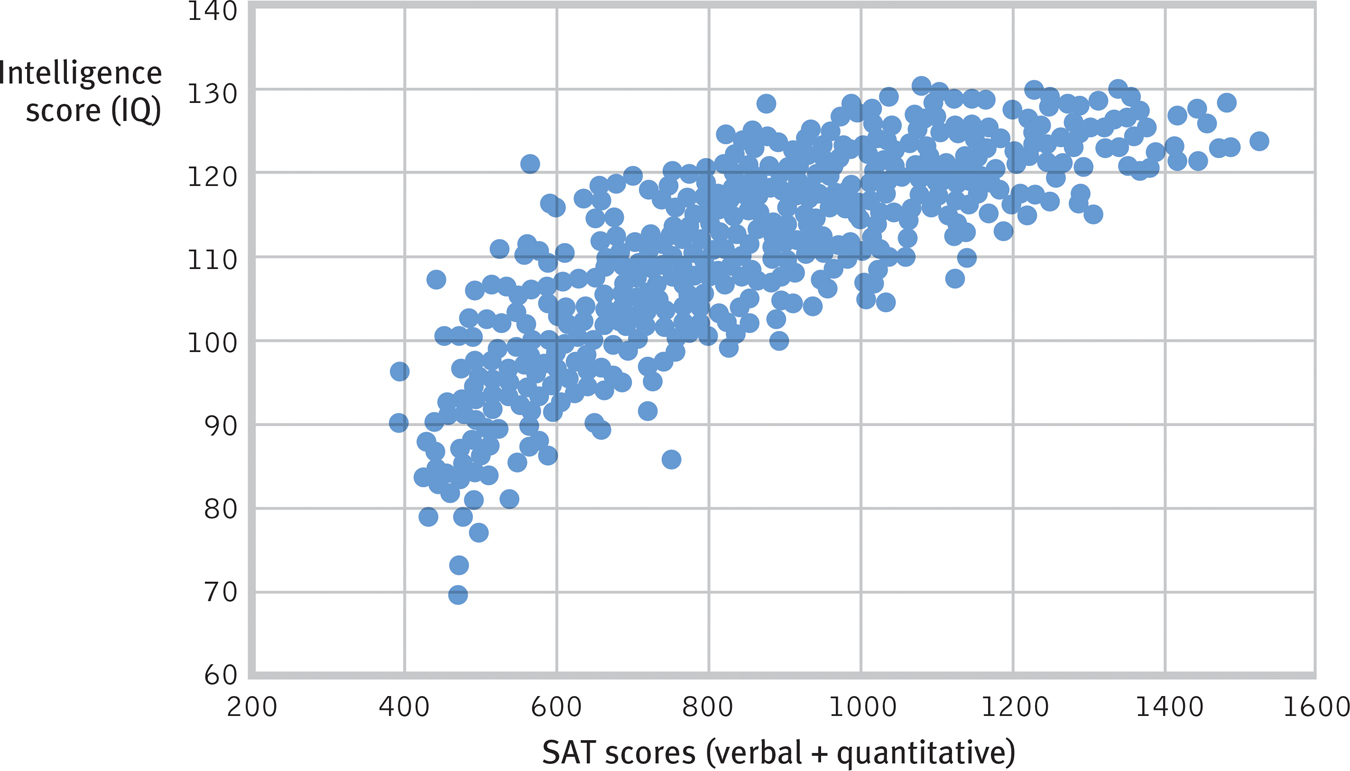
Close cousins: Aptitude and intelligence scores A scatterplot shows the close correlation that has existed between intelligence scores and verbal and quantitative SAT scores. (Data from Frey and Detterman, 2004.)
393
Early and Modern Tests of Mental Abilities
10-
Some societies concern themselves with promoting the collective welfare of the family, community, and society. Other societies emphasize individual opportunity. Plato, a pioneer of the individualist tradition, wrote more than 2000 years ago in The Republic that “no two persons are born exactly alike; but each differs from the other in natural endowments, one being suited for one occupation and the other for another.” As heirs to Plato’s individualism, people in Western societies have pondered how and why individuals differ in mental ability.
Francis Galton: Belief in Hereditary Genius
Western attempts to assess such differences began in earnest with English scientist Francis Galton (1822–
Although Galton’s quest for a simple intelligence measure failed, he gave us some statistical techniques that we still use (as well as the phrase nature and nurture). And his persistent belief in the inheritance of genius—
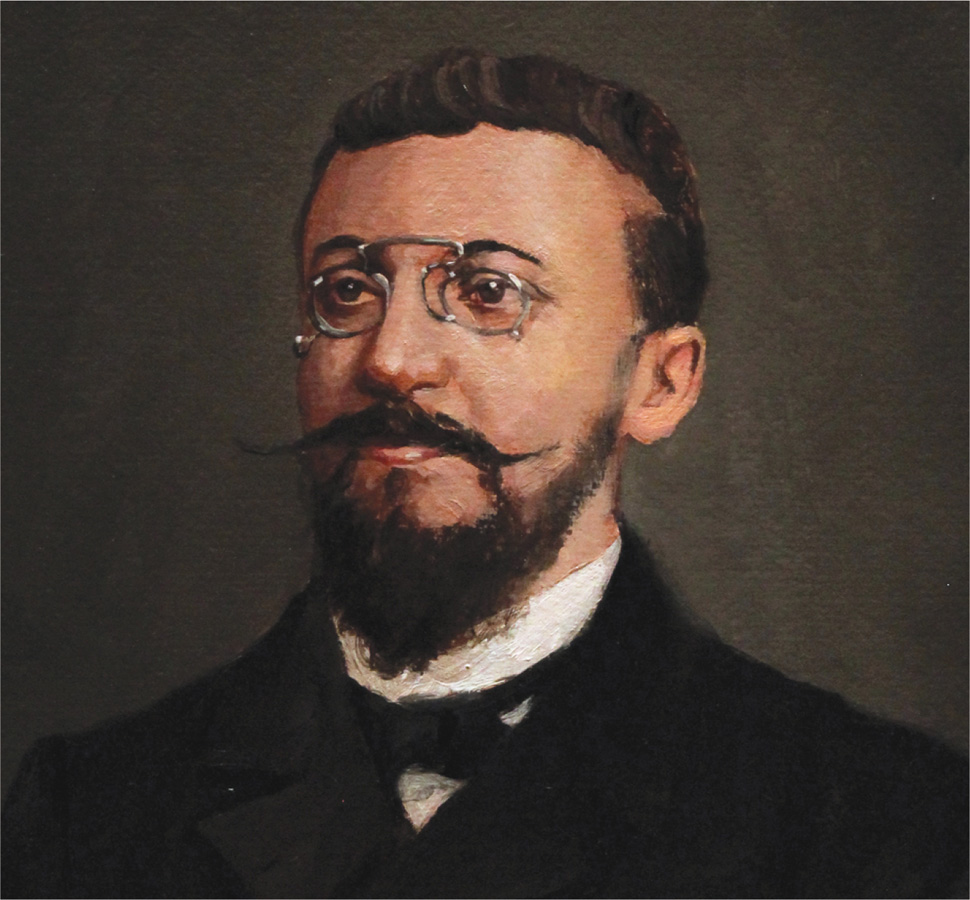
Alfred Binet: Predicting School Achievement
mental age a measure of intelligence test performance devised by Binet; the chronological age that most typically corresponds to a given level of performance. Thus, a child who does as well as an average 8-year-old is said to have a mental age of 8.
Modern intelligence testing traces its birth to early twentieth-
In 1905, Binet and Simon first presented their work under the archaic title, “New Methods for Diagnosing the Idiot, the Imbecile, and the Moron” (Nicolas & Levine, 2012). They began by assuming that all children follow the same course of intellectual development but that some develop more rapidly. On tests, therefore, a “dull” child should score much like a typical younger child, and a “bright” child like a typical older child. Thus, their goal became measuring each child’s mental age, the level of performance typically associated with a certain chronological age. The average 9-
To measure mental age, Binet and Simon theorized that mental aptitude, like athletic aptitude, is a general capacity that shows up in various ways. They tested a variety of reasoning and problem-
394
“The IQ test was invented to predict academic performance, nothing else. If we wanted something that would predict life success, we’d have to invent another test completely.”
Social psychologist Robert Zajonc (1984b)
Binet and Simon made no assumptions concerning why a particular child was slow, average, or precocious. Binet personally leaned toward an environmental explanation. To raise the capacities of low-
RETRIEVAL PRACTICE
- What did Binet hope to achieve by establishing a child’s mental age?
Binet hoped that the child’s mental age (the age that typically corresponds to the child’s level of performance), would help identify appropriate school placements of children.
Stanford-Binet the widely used American revision (by Terman at Stanford University) of Binet’s original intelligence test.
Lewis Terman: The Innate IQ
Binet’s fears were realized soon after his death in 1911, when others adapted his tests for use as a numerical measure of inherited intelligence. This began when Stanford University professor Lewis Terman (1877–
intelligence quotient (IQ) defined originally as the ratio of mental age (ma) to chronological age (ca) multiplied by 100 (thus, IQ = ma/ca × 100). On contemporary intelligence tests, the average performance for a given age is assigned a score of 100.
From such tests, German psychologist William Stern derived the famous intelligence quotient, or IQ. The IQ is simply a person’s mental age divided by chronological age and multiplied by 100 to get rid of the decimal point:
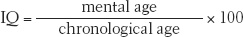
Thus, an average child, whose mental and chronological ages are the same, has an IQ of 100. But an 8-
The original IQ formula worked fairly well for children but not for adults. (Should a 40-
Terman (1916, p. 4) promoted the widespread use of intelligence testing to “take account of the inequalities of children in original endowment” by assessing their “vocational fitness.” In sympathy with Francis Galton’s eugenics—the much-
With Terman’s help, the U.S. government developed new tests to evaluate both newly arriving immigrants and World War I army recruits—
395
Binet probably would have been horrified that his test had been adapted and used to draw such conclusions. Indeed, such sweeping judgments became an embarrassment to most of those who championed testing. Even Terman came to appreciate that test scores reflected not only people’s innate mental abilities but also their education, native language, and familiarity with the culture assumed by the test. Abuses of the early intelligence tests serve to remind us that science can be value-
RETRIEVAL PRACTICE
- What is the IQ of a 4-year-old with a mental age of 5?
125 (5 ÷ 4 × 100 = 125)
David Wechsler: Separate Scores for Separate Skills
Psychologist David Wechsler created what is now the most widely used individual intelligence test, the Wechsler Adult Intelligence Scale (WAIS), together with a version for school-

- Similarities—Reasoning the commonality of two objects or concepts, such as “In what way are wool and cotton alike?”
- Vocabulary—Naming pictured objects, or defining words (“What is a guitar?”)
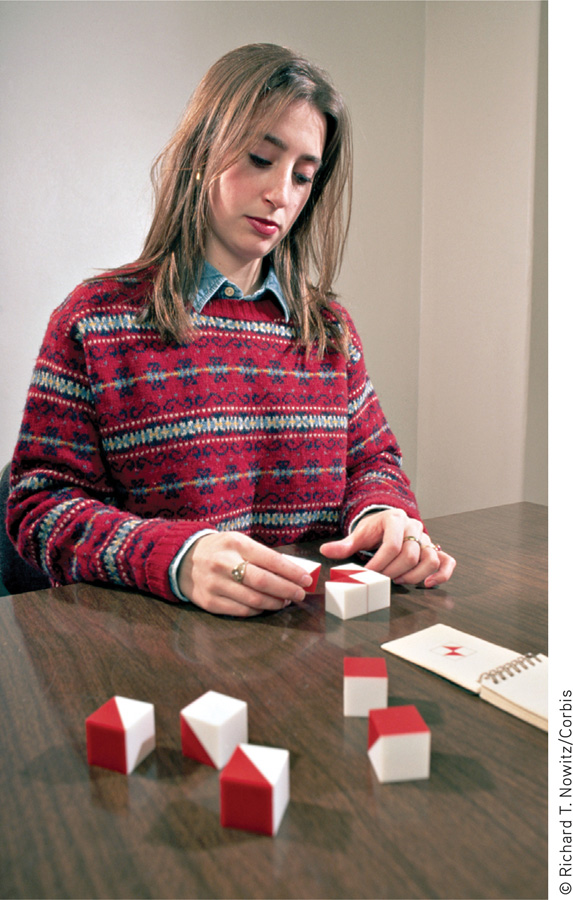
- Block Design—Visual abstract processing, such as “Using the four blocks, make one just like this.”
- Letter-Number Sequencing—On hearing a series of numbers and letters, repeat the numbers in ascending order, and then the letters in alphabetical order: “R-2-C-1-M-3.”
Wechsler Adult Intelligence Scale (WAIS) the WAIS and its companion versions for children are the most widely used intelligence tests; contain verbal and performance (nonverbal) subtests.
The WAIS yields not only an overall intelligence score, as does the Stanford-
RETRIEVAL PRACTICE
- An employer with a pool of applicants for a single available position is interested in testing each applicant’s potential. To help her decide whom she should hire, she should use an ______________ (achievement/aptitude) test. That same employer wishing to test the effectiveness of a new, on-the-job training program would be wise to use an ______________ (achievement/aptitude) test.
aptitude; achievement
Principles of Test Construction
10-
To be widely accepted, a psychological test must meet three criteria: It must be standardized, reliable, and valid. The Stanford-
396
standardization defining uniform testing procedures and meaningful scores by comparison with the performance of a pretested group.
Standardization
normal curve the bell-shaped curve that describes the distribution of many physical and psychological attributes. Most scores fall near the average, and fewer and fewer scores lie near the extremes.
The number of questions you answer correctly on an intelligence test would reveal almost nothing. To know how well you performed, you would need some basis for comparison. That’s why test-
If we construct a graph of test-
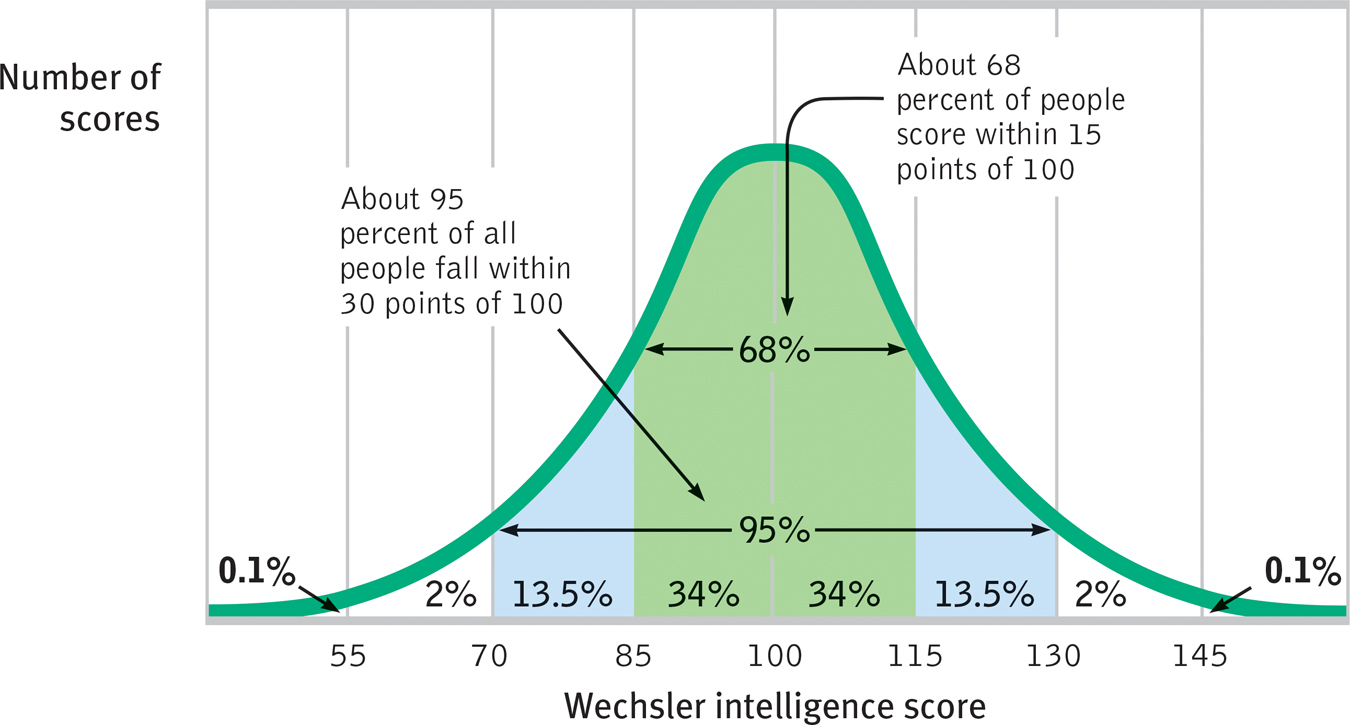
The normal curve Scores on aptitude tests tend to form a normal, or bell-
To keep the average score near 100, the Stanford-
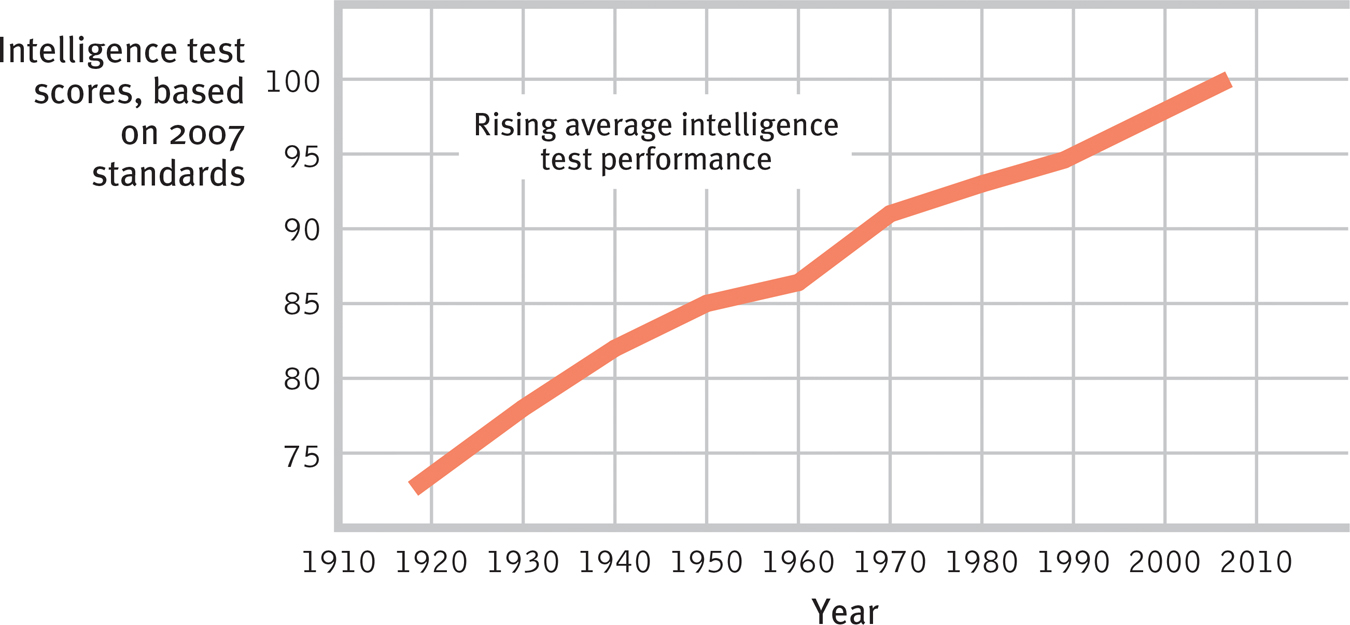
Getting smarter? In every country studied, intelligence test performance rose during the twentieth century, as shown here with American Wechsler and Stanford-
The Flynn effect’s cause has been a psychological mystery. Did it result from greater test sophistication? But the gains began before testing was widespread and have even been observed among preschoolers. Better nutrition? As the nutrition explanation would predict, people have gotten not only smarter but taller. But in postwar Britain, notes Flynn (2009), the lower-
397
reliability the extent to which a test yields consistent results, as assessed by the consistency of scores on two halves of the test, on alternative forms of the test, or on retesting.
Reliability
Knowing where you stand in comparison to a standardization group still won’t say much about your intelligence unless the test has reliability. A reliable test gives consistent scores, no matter who takes the test or when they take it. To check a test’s reliability, researchers test people many times. They may retest using the same test or they may split the test in half to see whether odd-
validity the extent to which a test measures or predicts what it is supposed to. (See also content validity and predictive validity.)
Validity
content validity the extent to which a test samples the behavior that is of interest.
High reliability does not ensure a test’s validity—the extent to which the test actually measures or predicts what it promises. Imagine using a miscalibrated tape measure to measure people’s heights. Your results would be very reliable. No matter how many times you measured, people’s heights would be the same. But your results would not be valid—
predictive validity the success with which a test predicts the behavior it is designed to predict; it is assessed by computing the correlation between test scores and the criterion behavior. (Also called criterion-related validity.)
Tests that tap the pertinent behavior, or criterion, have content validity. The road test for a driver’s license has content validity because it samples the tasks a driver routinely faces. Course exams have content validity if they assess one’s mastery of a representative sample of course material. But we expect intelligence tests to have predictive validity: They should predict the criterion of future performance, and to some extent they do.
Are general aptitude tests as predictive as they are reliable? As critics are fond of noting, the answer is plainly No. The predictive power of aptitude tests is fairly strong in the early school years, but later it weakens. Academic aptitude test scores are reasonably good predictors of achievement for children ages 6 to 12, where the correlation between intelligence score and school performance is about +.6 (Jensen, 1980). Intelligence scores correlate even more closely with scores on achievement tests: +.81 in one comparison of 70,000 English children’s intelligence scores at age 11 with their academic achievement in national exams at age 16 (Deary et al., 2007, 2009). The SAT, used in the United States as a college entrance exam, has been less successful in predicting first-
398
Why does the predictive power of aptitude scores diminish as students move up the educational ladder? Consider a parallel situation: Among all American and Canadian football linemen, body weight correlates with success. A 300-
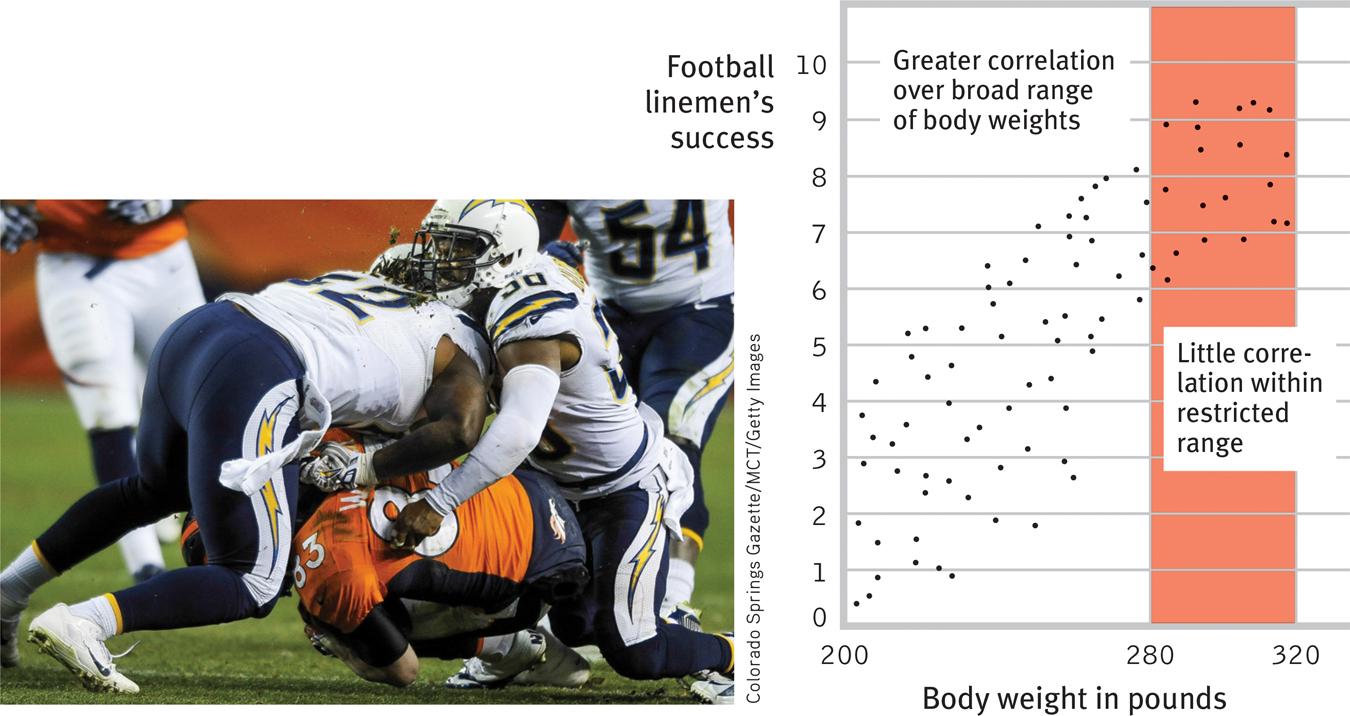
Diminishing predictive power Let’s imagine a correlation between football linemen’s body weight and their success on the field. Note how insignificant the relationship becomes when we narrow the range of weight to 280 to 320 pounds. As the range of data under consideration narrows, its predictive power diminishes.
RETRIEVAL PRACTICE
- What are the three criteria that a psychological test must meet in order to be widely accepted? Explain.
A psychological test must be standardized (pretested on a similar group of people), reliable (yielding consistent results), and valid (measuring what it is supposed to measure).
- Correlation coefficients were used in this section. Here’s a quick review: Correlations do not indicate cause-effect, but they do tell us whether two things are associated in some way. A correlation of −1.0 represents perfect ______________ (agreement/disagreement) between two sets of scores: As one score goes up, the other score goes ______________ (up/down). A correlation of ______________ represents no association. The highest correlation, +1.0, represents perfect ______________ (agreement/disagreement): As the first score goes up, the other score goes ______________ (up/down).
disagreement; down; zero; agreement; up
399
REVIEW: Assessing Intelligence

|
REVIEW | Assessing Intelligence |
LEARNING OBJECTIVES
RETRIEVAL PRACTICE Take a moment to answer each of these Learning Objective Questions (repeated here from within this section). Then click the 'show answer' button to check your answers. Research suggests that trying to answer these questions on your own will improve your long-term retention (McDaniel et al., 2009).
10-
An intelligence test is a method for assessing an individual’s mental aptitudes and comparing them with others, using numerical scores. Aptitude tests measure the ability to learn, while achievement tests measure what we have already learned.
10-
In the late 1800s, Francis Galton, who believed that genius was inherited, attempted but failed to construct a simple intelligence test. Alfred Binet, who tended toward an environmental explanation of intelligence differences, started the modern intelligence-testing movement in France in 1904 when he developed questions to help predict children’s future progress in the Paris school system. During the early twentieth century, Lewis Terman of Stanford University revised Binet’s work for use in the United States. Terman believed intelligence was inherited, and he thought his Stanford-Binet could help guide people toward appropriate opportunities. From such tests, William Stern contributed the concept of the IQ (intelligence quotient). During this period, intelligence tests were sometimes used to “document” scientists’ assumptions about the innate inferiority of certain ethnic and immigrant groups.
The most widely used intelligence tests today are the Wechsler Adult Intelligence Scale (WAIS) and Wechsler’s tests for children. These tests differ from their predecessors in the way they offer an overall intelligence score as well as scores for various verbal and performance areas.
10-
The distribution of test scores often forms a normal (bell-shaped) curve around the central average score, with fewer and fewer scores at the extremes.
Standardization establishes a basis for meaningful score comparisons by giving a test to a representative sample of future test-takers. Reliability is the extent to which a test yields consistent results (on two halves of the test, on alternative forms of the test, or when people are retested). Validity is the extent to which a test measures or predicts what it is supposed to. A test has content validity if it samples the pertinent behavior (as a driving test measures driving ability). It has predictive validity if it predicts a behavior it was designed to predict. (Aptitude tests have predictive ability if they can predict future achievements; their predictive power is best for the early school years.)
TERMS AND CONCEPTS TO REMEMBER
RETRIEVAL PRACTICE Match each of the terms on the left with its definition on the right. Click on the term first and then click on the matching definition. As you match them correctly they will move to the bottom of the activity.
Question
8xezPFyjuW1BcYYDmD5HKV/gnuge1ZlhZnxxxQWeaEuSMv3BCwj1LvQxmLbUTdzf9SVsmNsnRRtmRdGtUKGU87jpFSXMhudsp6Xu3yt22WOPdfGMfkLSJ0ZjHPG5r8vmMkmjLdey4fdNA8Blip2bAhU2rGQMEVCVh52RB2+eNVSlstp2bXnkXNItFfjd2C4gSG/nLTQ8927qg+84qUzq777U2CfNoRtqNOI0RUmSCozvBSq3tvxq2dZqLX7BxXPg83Fm+uSL1duO01vuzuvxFE2ppybV8jFQC1J13rNSxGQz0KlUX+9lFQ7wLZYJHPkNiNi2Y6NZE+B/Kh4Nw+WGYXVZ0/BKDOi/PV8E4F8U8QP9arArThQZcKMQYkeJU4hoZWpmeh+9KJk/qD0olDym75ZTU8Yxh/7BDzDRSWw88qx6ktnuQGbMPcmq0WyXQi+9I/EJb5unpY9SLMranmVzCVeiOw+bn6wTzglqgfPZ6ITTdSDBQ6L/5Sv5pKMGwPTu2w7dZGfmORya+m7E3R/g2uL9P3rP4UmOq6ejDwSV2vW/Q2pQ5/J+tBT5M4gASlV24SCph3HkA5oiguGh2ATvfi0wigtvcsMuNzy/FmGLmcT3VgML+ppihxwP9zVBL0Wsxz/fI0ztR8qdPn4q7PJh0IpudqzomWGbAIlNvj8eJsTI1h9KwIRr8C2LIQOv8cK/2XY0uKnMI9h1Ep8OaXi+YGR9PNeUjCgc9Sz1yKEZ4toSFXPbiDIFAFrJT9UcABzvcLmiMWc4V9rufCue+P3gCez91mn1G4Qtc8BHJeJeg2vV0Z7ZP46beKP+idRNBKCGKXsh6gJGVcsPmcMFHPB0Jmf1GnkUZ2L2mntuhSc0PxgOKxDq8CNsuZsJ7gtZFvU3Urqs4gvHXAtRd6F4ndUeVrPVdFMIF23JfRvpxTkbKQ4fIJcW1AqpYH3smHLX1SdmY4mkyTf3kM9YRiGqGlNvwIVMTXgS+DvIym+xRibjQ1DYRr5TeElwKALJwse58TFz2au1OoNNm5gX+QG/7QhkNuAk1taIHO8XkXGwbzbs4sLj/oilm71DOy6o154+ysvofxklcqBdZXi+THx+SCx9gFTxJlBVcvnJ0NEuWomOP5nFSErAeMnYBqdPOhrL6vx9aotbyEGlB2EjU2eqUjWcr2pFkp88zStRaVpGYaTim1BqGPvSzEzcqHnJAOJIcWQ/pxpvKMSzq+Sl0S9DxfEWIOg37YLM1Q01VFGRpuGIvneh6SRPvrouVvwqpEkONCxYfKeonaMbYEE2sYNTdKQ4qxBVeipYcz9WxoPcTwN2MTEFyhqGZFa0i3NdBatCmOKmPrwgBIjQtUY/zpYpNrvpP0OaOtUtXhMDAtdhqyazSq6gJEL88sf08XQ5NGCcgkN5jhoyFxDrVmUpLpZVYEQ4at7lghi/EPe23c+dvY70OcBNsu+618pDRmpaCCLFCbjx22MfUWRUSZgMVqvt6+EQyXH+9YG5GMPSB0R53pp0kIMzaj8c5JU/RoUdUys6jR/XoRi8rUn/qNCBjvu7oeCiq8WfoA8BxRgpjgIY15EJnB2XlFMu8oa77zAoEjYCd/be7DepY+B95Xc1EO8rGE/BJyLHvhJLwjWBvdYflowJFy+vOyLpaZrvkpXRoJBQqTYKuVASyqd31myYQDg+kvXBLWhaPyAstQEEfL/AT7ArpioMEMWS01EQeSdwOxnyT+KLmqTySpcwBFsLgL3Lt9a0pOlmHRmh29/EioTUKqchYrHyXT+1ABmZuNSE31pWJYRCFo6YyQrf4m+CotOfFE0BS8is1yrJsH2m+6MlpNpTL70euIZd3WG0IC0tJHQ4TEyQZAW7IF6LNjDYp63tJErtzi4kPWwACaPzlj/cDKAQmheH+3/PEBL3Hc9SEFRg4ldJ/LwNLBNyJuTW8LzzjzH4JANn4dpRrz8mikYXIX+/5ulVHijNbms7I0RErkqyS4RfU3YYxaVFaOlqfYhJnzX3Q0vzitLMODvEYeJ4kzMsphrPphlf0SCZixcqwFnKMwKRQm8MlIjZS8ZhGKrsljzO/2U+Q9n/jbEliOKo8xOfX/E+TKvuzvUCqJ4+IU/FomZlwYkgmQGkZF2Ccn/acXa5ie94By9zEwCO6sfzHf3iQWWSrF4Z97DwbwVp31g7V8YQBA0kGNvxItQLwRFTjidUwKO1NsnfCLU7jL7urAEtBiR+xCeX9g/awOIZ8YyuhaJckIneBe3OcKkV5qZd9I38jAW64sxKn2Vlx+FBY5ofPJDGH5uIdQk13SDFWkyI3wn2yHAaI2YtxdFQToT3/rCo/kGlhzEkSzS8dBNX5meGYUXwig1WgsahVTSNxOgtg62d2Q2gjwvUN4hsXleAv54NM52WcEcf5UnP6VvS4SSZIoORwCkabF+o5s6RI8t/8zeSe88Ve0Q2D4wf/VAKMyXIStaDTNk0PkWJuSxV6bTIRZNPU1IzJKNlglhwZI5x+aWSFkRhdjmJx3Kg379F14ZVlY0vblZpwx7gv37SBWtdrJhW+LtQo2SucN0MXB5HGCG4SHBsSbpYSd/UjK/u29KTvGhNoiLNjlplt6OHJfigRHqzBwB8uRrKJ/UMl801I4ynTcw6AcLMqig1FZ6c6vGZadcGniInJV5btXSfl4/ysKMyMjBMgfCKjKl8oCP3yOEtomHJinirL1uQdRo+WuTIWNOKlHalrTxNQhjzjIbyYEoVLmReW0nI8bJe31cNIK69xrNNhSYfs2U9ioNHOACJSMF3DahCNWXzxEy8CKQuJ+7NU1/GD4EwznIAwQfo6vchP4ymh2nhFW4Ax3fXS4/o1+XY8itvkIk0SOQeq8JnlUUzIx1flk/50DzuvE2EC3NPi9JkbuTFg4EsI8VG/vq/AQcWADpcZh0abEmFK6VppyP4s1eeQR8RpHzTnfGJABvyuk72ig==Use  to create your personalized study plan, which will direct you to the resources that will help you most in
  .
.