10.3 The Dynamics of Intelligence
Researchers are exploring some age-
Here we will focus on two other questions: How stable is intelligence over the life span? (Will the precocious 5-
Stability or Change?
10-
If we retested people periodically throughout their lives, would their intelligence scores be stable? Let’s first explore the stability of mental abilities in later life.
Aging and Intelligence
What happens to our intellectual muscles as we age? Do they gradually decline, as does our body strength? Or do they remain constant? The quest for answers to these questions illustrates psychology’s self-
400
Phase I: Cross-
For a long time, this rather dismal view went unchallenged. Many corporations established mandatory retirement policies, assuming the companies would benefit by replacing aging workers with younger, more capable, employees. As “everyone knows,” you can’t teach an old dog new tricks.
Phase II: Longitudinal Evidence for Intellectual Stability After colleges in the 1920s began giving intelligence tests to entering students, several psychologists saw their chance to study intelligence longitudinally. They retested the same cohort—the same group of people—
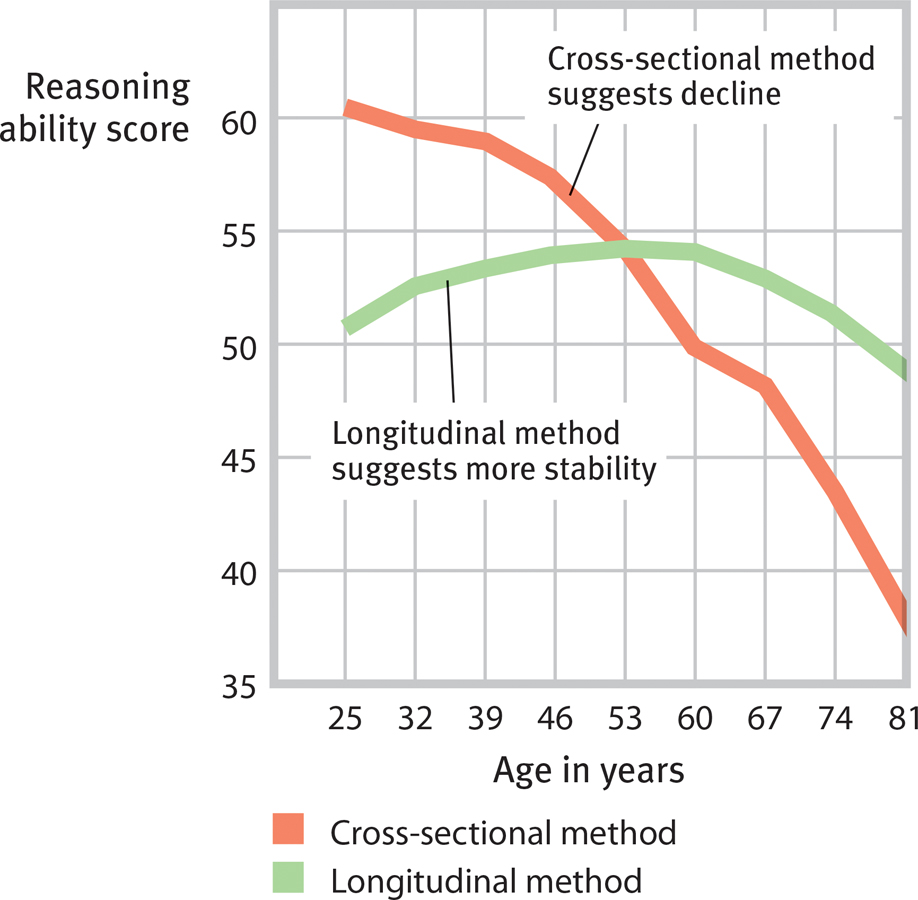
Cross-
cohort a group of people sharing a common characteristic, such as from a given time period.
How then are we to account for the cross-
With the more optimistic results from longitudinal studies, the myth that intelligence sharply declines with age was laid to rest. Famed painter Anna Mary Robertson Moses (“Grandma Moses”) took up painting in her seventies, and at age 88 a popular magazine named her “Young Woman of the Year.” At age 89, architect Frank Lloyd Wright designed New York City’s Guggenheim Museum. As “everyone knows,” given good health, you’re never too old to learn.
Phase III: It All Depends With “everyone knowing” two different and opposing facts about age and intelligence, something was wrong. As it turns out, longitudinal studies have their own pitfalls. Those who survive to the end of such studies may be bright, healthy people whose intelligence is least likely to decline. (Perhaps people who died younger and were removed from the study had declining intelligence.) Adjusting for the loss of participants, as did a study following more than 2000 people over age 75 in Cambridge, England, revealed a steeper intelligence decline, especially after 85 (Brayne et al., 1999).
Research is further complicated by the finding that intelligence is not a single trait, but rather several distinct abilities. Intelligence tests that assess speed of thinking may place older adults at a disadvantage because of their slower neural processing. Meeting old friends on the street, names rise to the mind’s surface more slowly—
“Knowledge is knowing a tomato is a fruit; wisdom is not putting it in a fruit salad.”
Anonymous
So the answers to our age-
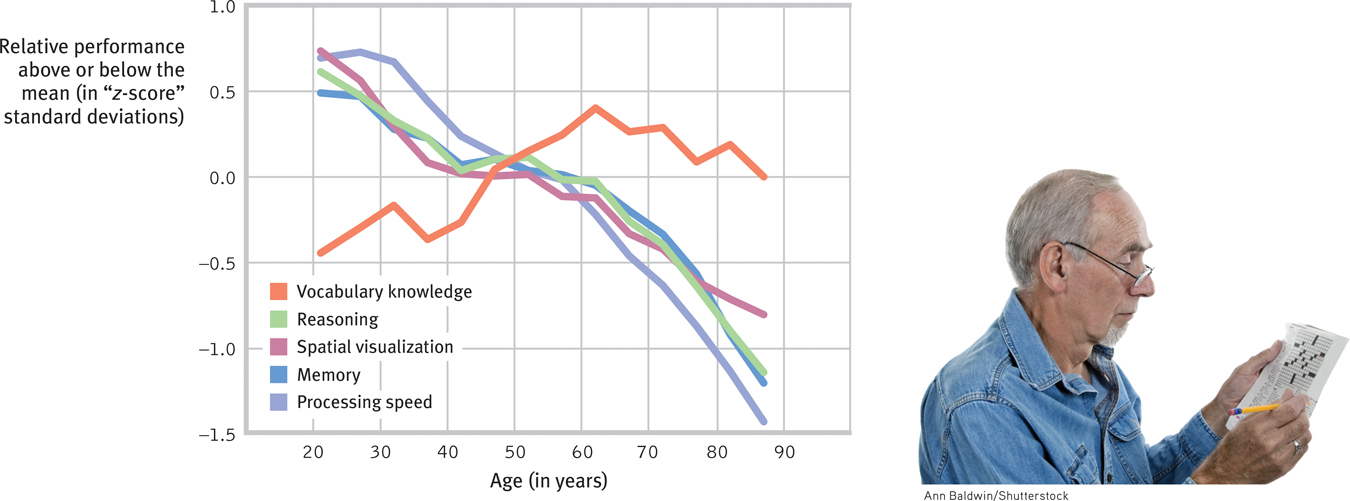
With age, we lose and we win . Studies reveal that word power grows with age, while fluid intelligence dimensions decline. (Data from Salthouse, 2010.)
crystallized intelligence our accumulated knowledge and verbal skills; tends to increase with age.
fluid intelligence our ability to reason speedily and abstractly; tends to decrease during late adulthood.
401
Age-
“In youth we learn, in age we understand.”
Marie Von Ebner-Eschenbach, Aphorisms, 1883
RETRIEVAL PRACTICE
- Researcher A is well-funded to learn about how intelligence changes over the life span. Researcher B wants to study the intelligence of people who are now at various life stages. Which researcher should use the cross-sectional method, and which the longitudinal method?
Researcher A should develop a longitudinal study to examine how intelligence changes in the same people over the life span. Researcher B should develop a cross-
Stability Over the Life Span
“My dear Adele, I am 4 years old and I can read any English book. I can say all the Latin substantives and adjectives and active verbs besides 52 lines of Latin poetry.”
Francis Galton, letter to his sister, 1827
Now what about the stability of intelligence scores early in life? Infants’ and toddlers’ attention, processing speed, and learning give some clue to their intelligence score in later childhood and early adulthood (Fagan, 2011; Rose et al., 2012). For extremely impaired or very precocious children, those early indications can be very predictive. Yet for most children, casual observation and intelligence tests before age 3 only modestly predict their future aptitudes (Humphreys & Davey, 1988; Tasbihsazan et al., 2003). Even Albert Einstein was once thought “slow”—as he was in learning to talk (Quasha, 1980).
402
Ironically, SAT and GRE scores have correlated better with each other than either has with its intended criterion, school achievement. Thus, their reliability has far exceeded their predictive validity. If either test was much affected by coaching, luck, or how one feels on the test day (as so many people believe), such reliability would be impossible.
By age 4, however, children’s performance on intelligence tests begins to predict their adolescent and adult scores. The consistency of scores over time increases with the age of the child. The remarkable stability of aptitude scores by late adolescence is seen in a U.S. Educational Testing Service study of 23,000 students who took the SAT and then later took the GRE (Angoff, 1988). On either test, verbal scores correlated only modestly with math scores—
Ian Deary and his colleagues (2004, 2009, 2013) set the record for long-
And so it has, with dozens of studies of the stability and the predictive capacity of these early test results. For example, when the intelligence test administered to 11-
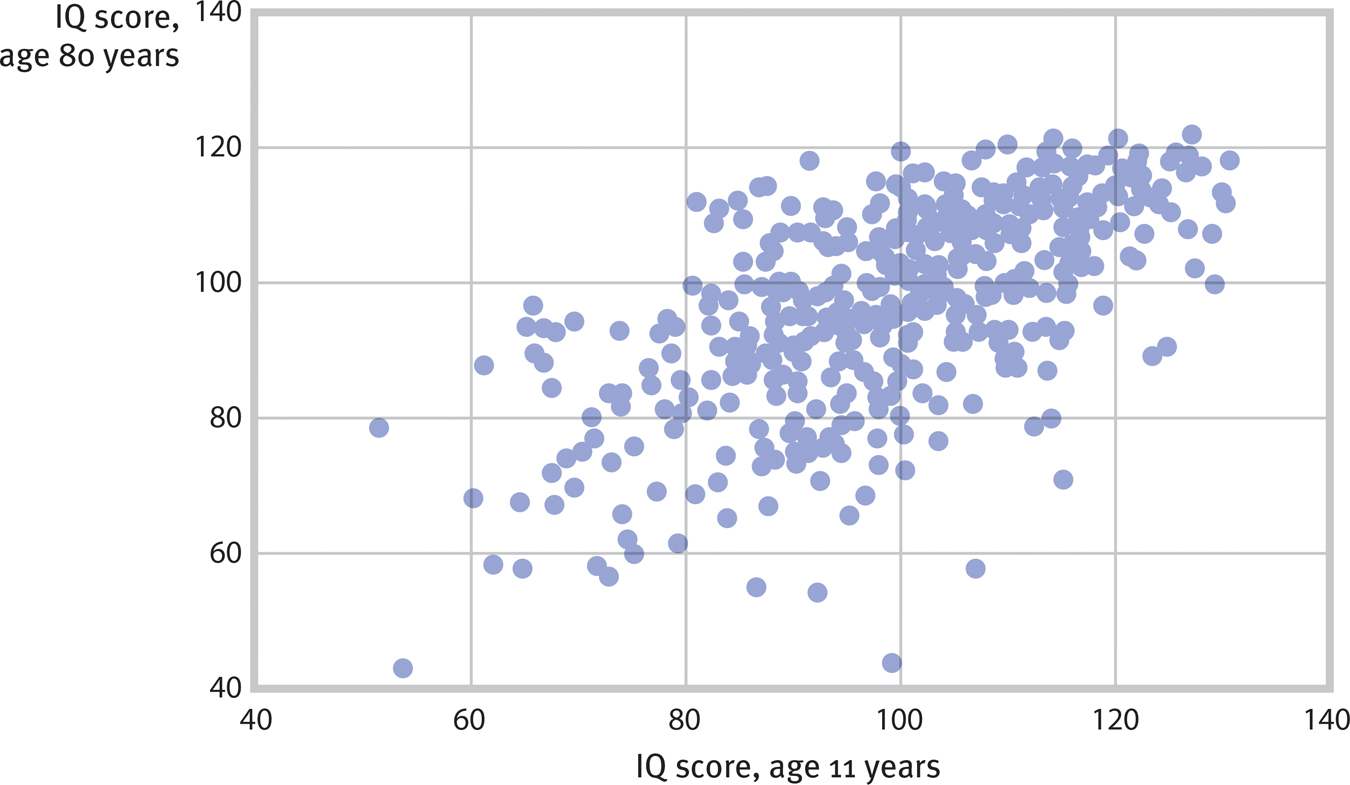
Intelligence endures When Ian Deary and his colleagues (2004) retested 80-
“Whether you live to collect your old-age pension depends in part on your IQ at age 11.”
Ian Deary, “Intelligence, Health, and Death,” 2005
High-
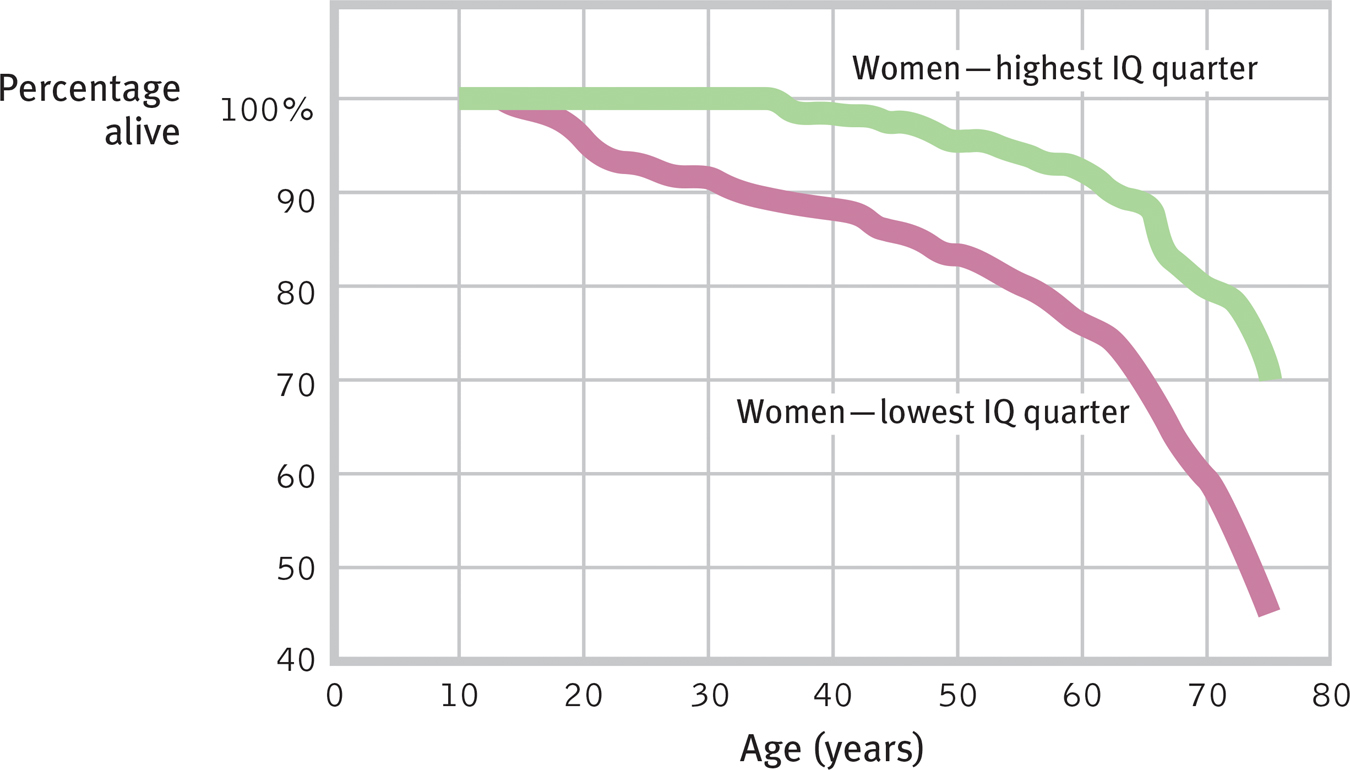
Living smart Women scoring in the highest 25 percent on the Scottish national intelligence test at age 11 tended to live longer than those who scored in the lowest 25 percent. (Data from Whalley & Deary, 2001.)
403
Pause a moment: Have you any idea why more intelligent people might live longer? Deary (2008) reports four possible explanations:

Explore how researchers have studied these issues with LaunchPad’s How Would You Know If Intelligence Changes With Age?
- Intelligence facilitates more education, better jobs, and a healthier environment.
- Intelligence encourages healthy living: less smoking, better diet, more exercise.
- Prenatal events or early childhood illnesses might have influenced both intelligence and health.
- A “well-wired body,” as evidenced by fast reaction speeds, perhaps fosters both intelligence and longevity.
Extremes of Intelligence
10-
One way to glimpse the validity and significance of any test is to compare people who score at the two extremes of the normal curve. The two groups should differ noticeably, and they do.
The Low Extreme
At one extreme of the intelligence test normal curve are those with unusually low scores. To be diagnosed with an intellectual disability (formerly referred to as mental retardation), a person must meet two criteria. The first is a low test score. American Association on Intellectual and Developmental Disabilities guidelines specify performance that is approximately two standard deviations below average (Schalock et al., 2010). For an intelligence test with 100 as average and a standard deviation of 15, that means (allowing for some variation in one’s test score) an intelligence score of approximately 70 or below. The second criterion is that the person must have difficulty adapting to the normal demands of independent living, as expressed in three areas:
- conceptual skills, such as language, literacy, and concepts of money, time, and number.
- social skills, such as interpersonal skills, social responsibility, and the ability to follow basic rules and laws and avoid being victimized.
- practical skills, such as daily personal care, occupational skill, travel, and health care.
intellectual disability a condition of limited mental ability, indicated by an intelligence test score of 70 or below and difficulty adapting to the demands of life. (Formerly referred to as mental retardation.)
Down syndrome a condition of mild to severe intellectual disability and associated physical disorders caused by an extra copy of chromosome 21.
Intellectual disability is a developmental condition that is apparent before age 18, sometimes with a known physical cause. Down syndrome, for example, is a disorder of varying severity caused by an extra copy of chromosome 21 in the person’s genetic makeup.
Consider one reason why people diagnosed with a mild intellectual disability—
404
And in the United States (one of only a few industrialized countries with the death penalty), fewer people are now eligible for execution: The U.S. Supreme Court ruled in 2002 that the execution of people with an intellectual disability is “cruel and unusual punishment.” For people near the cutoff score of 70, intelligence testing can be a high-
In 2014, the U.S. Supreme Court recognized the imprecision and arbitrariness of a fixed cutoff score of 70, and required states with death row inmates who have scored just above 70 to consider other evidence. Thus, Ted Herring, who had scored 72 and 74 on intelligence tests—
RETRIEVAL PRACTICE
- Why do psychologists NOT diagnose an intellectual disability based solely on the person’s intelligence test score?
IQ score is only one measure of a person’s ability to function. Other important factors to consider in an overall assessment include conceptual skills, social skills, and practical skills.
The High Extreme
In one famous project begun in 1921, Lewis Terman studied more than 1500 California schoolchildren with IQ scores over 135. Contrary to the popular notion that intellectually gifted children are frequently maladjusted, Terman’s high-
Terman did test two future Nobel laureates in physics, but they failed to score above his gifted sample cutoff (Hulbert, 2005).
A more recent study of precocious youths who had aced the math SAT at age 13—
One of psychology’s whiz kids was Jean Piaget, who by age 15 was publishing scientific articles on mollusks and who went on to become the twentieth century’s most famous developmental psychologist (Hunt, 1993). Children with extraordinary academic gifts are sometimes more isolated, shy, and in their own worlds (Winner, 2000). But most thrive.
405

There are critics who question many of the assumptions of “gifted child” programs, such as the belief that only 3 to 5 percent of children are gifted and that it pays to identify and “track” these special few—
Critics and proponents of gifted education do, however, agree on this: Children have differing gifts, whether at math, verbal reasoning, art, or social leadership. Some children exhibit exceptional potential or talent in a given domain. Educating children as if all were alike is as naive as assuming that giftedness is something, like blue eyes, that you either have or do not have. One need not hang labels on children to affirm their special talents and to challenge them all at the frontiers of their own ability and understanding. By providing appropriate placement suited to each child’s talents (as when allowing a math whiz to study math at a higher level), we can promote both equity and excellence for all (Subotnik et al., 2011).
REVIEW: The Dynamics of Intelligence

|
REVIEW | The Dynamics of Intelligence |
LEARNING OBJECTIVES
RETRIEVAL PRACTICE Take a moment to answer each of these Learning Objective Questions (repeated here from within this section). Then click the 'show answer' button to check your answers. Research suggests that trying to answer these questions on your own will improve your long-term retention (McDaniel et al., 2009).
10-
Cross-sectional studies (comparing people of different ages) and longitudinal studies (retesting the same group over a period of years) have shown that fluid intelligence declines in older adults, in part because neural processing slows. However, crystallized intelligence tends to increase.
The stability of intelligence test scores increases with age. At age 4, scores fluctuate somewhat but begin to predict adolescent and adult scores. By early adolescence, scores are very stable and predictive.
10-
At the low extreme are those with unusually low scores. An intelligence test score of or below 70 is one diagnostic criterion for the diagnosis of intellectual disability; other criteria are limited conceptual, social, and practical skills. One condition included in this category is Down syndrome, a developmental disorder caused by an extra copy of chromosome 21.
People at the high-intelligence extreme tend to be healthy and well-adjusted, as well as unusually successful academically. Schools sometimes “track” such children, separating them from students with lower scores. Such programs can become self-fulfilling prophecies as both groups live up to—or down to—others’ perceptions and expectations.
TERMS AND CONCEPTS TO REMEMBER
RETRIEVAL PRACTICE Match each of the terms on the left with its definition on the right. Click on the term first and then click on the matching definition. As you match them correctly they will move to the bottom of the activity.
Question
nvPp8syAgrF9PUSWjUJaQw0dVVfKLHqBrIPs8GuIWzLskEV4uM4NXAuF3DxrWUG56W4S1RTIQ8SXvj7D0PqsR9vBDW/B52K2dZdCgyhjxhtWwqvQbFttvWrbWRbJUIORim0a8YIyYBwogVnYfj+HfYIIRVsJPhmOFyYYYqtg/DIr/9Htn4rB42qvANVjpBiShUtd6374P4JPB6zueUAjz3Ny/63EL8QdI1HuLmDmLDLf9z17T58oqWVylIufnakWPE8ujS4Q9cMZH+G+nItTjo5tDmyL/DPKPFPv+XrTo8eDHWzi/J+XZg4AV0YzWAZBxxpajQS+6otdvmH2n6mzPfSnenIS8Fsnv22X3kBlkgcoN1qlvDkMFaUWd3kR3ZttCON6evVZ5GA50OYD13Akp6NVpEN+cWBsTm5w3fFVa545NALAt9QU4lye8XzrBPPQa6w+LLCLsVlD/iiHV4mzwz/EOCo3SeG/NOR5LFgcgF/ZYbpE71FaIrCoRZIgM6OEFXBwuE98W1YjkUt9EJDB9BEpJK1BSTtdKCxMxg878viYMtfWl34I93Qo3Idp+M/LqhC4n9iCjsHJuWmSAoT1DETI57KLDTGRO2OHPUnDupwjT6/tPKH84V3NojT8D7fu6g5Y2uUlvDdOsVqRO31yCIVon+SB/1al92Y3BNyJQe+GvbUv0ez3DhWAYq2cz9s4zmC7M5Nkqz09LxmAukcfmxKYKCbbE+rM/FcF8eZMKhmTzZ7HYzl+TkJZTHQz67ecO70Ze+pqEogAF3Y5spCD+0UE7qc3c4S/dY++DgL4EqrRbhjP+h/Vbjo2QwrbpSp+o5LcdFjOYBF9YWv8PH4bcMf6obfxnxlnrjXo7D6cSZIm971nC0WO41cukjgG4JT40btLNa1NW7h5CH2yUse  to create your personalized study plan, which will direct you to the resources that will help you most in
  .
.