FIGURE 11-
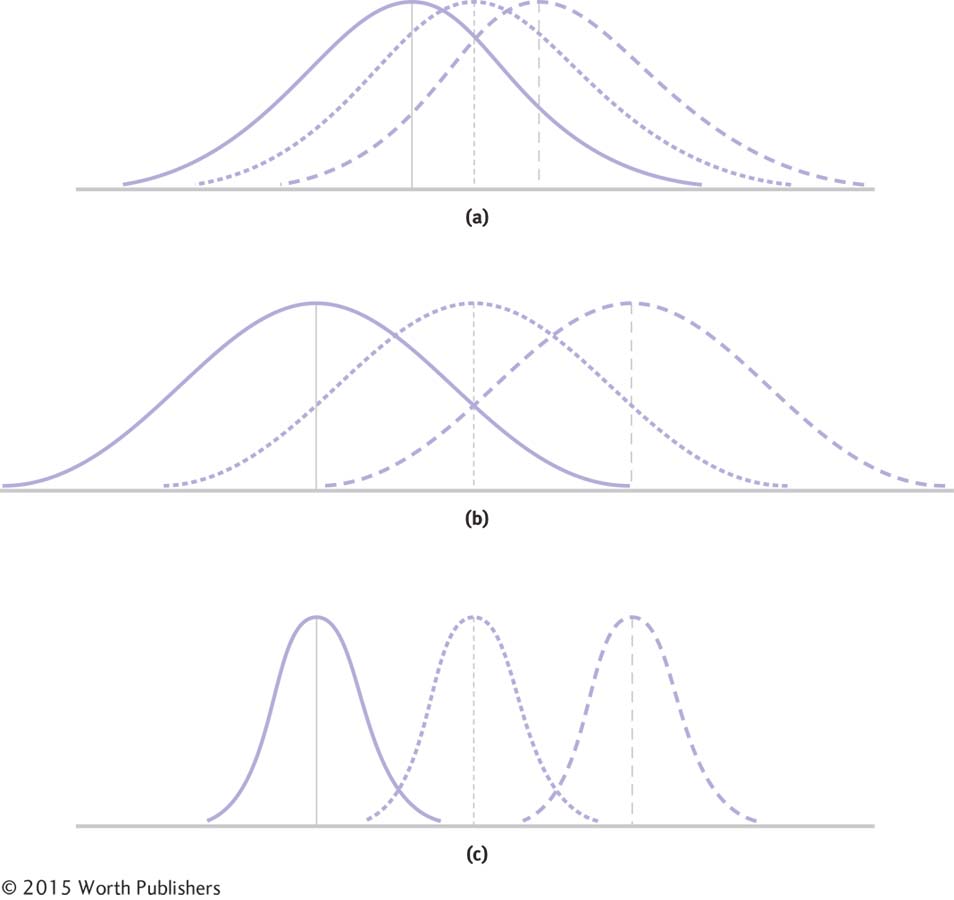
The Logic of ANOVA
Compare the top (a) and middle (b) sets of sample distributions. As the variability between means increases, the F statistic becomes larger. Compare the middle (b) and bottom (c) sets of sample distributions. As the variability within the samples themselves decreases, the F statistic becomes larger because there is less overlap between the three curves. Both the increased spread among the sample means and the decreased spread within each sample contribute to this increase in the F statistic.